Figures & data
Table 1. Point estimates (and 95% confidence intervals) of tactical positioning importance calculated without race-specific athlete-opponent interactions.
Figure 1. Evaluating tactical positioning using the with race-specific athlete-opponent interactions approach. (a) 2D histogram of the similarity between start position/ intermediate rankings (Laps 1–8) and final rankings (Lap 9). The density represents the proportion of races in the dataset, and the white dot denotes each lap’s modal Kendall’s τb value. (b) 1D histogram of Lap 2’s similarity between intermediate and final rankings.
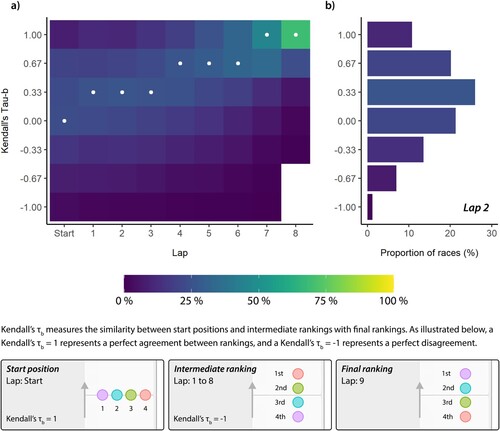
Figure 2. Tactical positioning sequences in a 1,000 m race with four athletes. Each node represents the similarity between start position/ intermediate rankings (Laps 1–8) and final rankings (Lap 9). Each edge represents how a node can transition to future and past laps. The highlighted nodes and edges illustrate an example sequence of (−0.67, −0.67, 0, 0, −0.33, −0.33, 0.33, 0.67, 1). This sequence is one of 40,353,607 possible tactical positioning sequences in this race scenario.
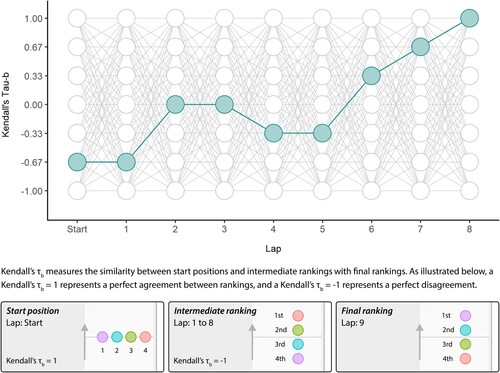
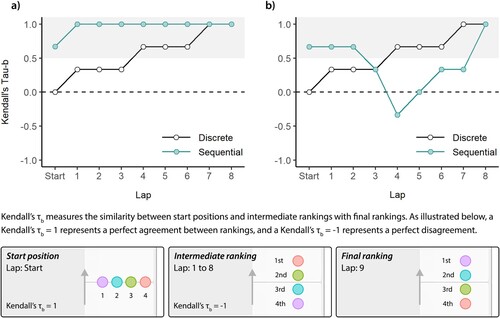
Figure 3. Effect of treating laps as discrete or sequential events. Comparison of with race-specific athlete-environment interactions discrete, point estimates, i.e. the modal similarity between start position/ intermediate rankings (Laps 1–8) and final rankings (Lap 9), with two observed tactical positioning sequences of the form . (a) the most commonly occurring sequence (absolute support = 18 races; relative support = 1.2%), and (b) an observed tactical positioning sequence (absolute support = 4 races; relative support = 0.3%). In both plots, the shaded region represents Kendall’s τb values where the start position/ intermediate rankings and final rankings are deemed to have a strong similarity.