Figures & data
Figure 1. Postures of the shoulder and elbow joints (A and B) and operating ranges of each triceps brachii muscle on the normalised force–length curve (C–E) during the elbow extensions performed in the overhead and neutral arm positions. These were obtained using the OpenSim Arm26 model, (Delp et al., Citation2007) with the shoulder joint flexed at 180° and 0° for the overhead and neutral conditions, respectively, and the elbow joint angle ranging 90−0° for both conditions as conducted in this study. It can be clearly seen that the TBLong operates at longer muscle lengths in the overhead than neutral condition, while there is no difference between the conditions in the TBLat and TBMed. TBLong = triceps brachii long head; TBLat and TBMed triceps brachii lateral and medial heads, respectively.
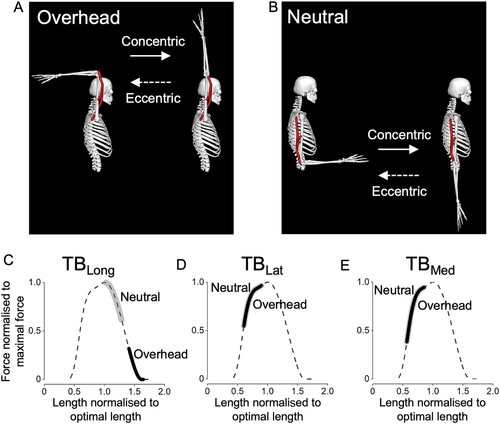
Figure 2. Example images of the right arm MRIs at ∼50% of the whole length of the triceps brachii taken at Pre (A) and Post (B). Anatomical cross-sectional areas of the Long, Lat, and Med heads of the triceps brachii are drawn. Lat = lateral; Long = long; Med = medial; Post = post-training; Pre = pre-training.
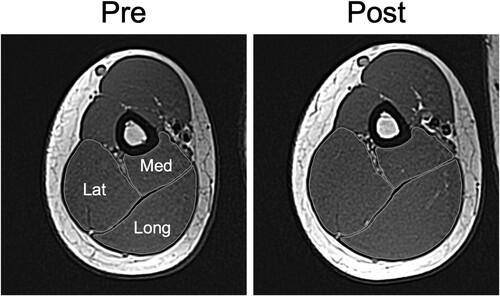
Figure 3. Relative (A) and absolute (B) training load used in the training sessions. Training load was gradually increased at the first, second, and third sessions from 50%, 60%, and 70% 1RM measured pre-training, respectively, and 70% of 1RM was used thereafter. If the participants could complete all the prescribed protocol at the third session and thereafter without repetition failure, +5% 1RM was added at the subsequent sessions. *P < 0.05, between conditions. Neutral-Arm = the arm that trained in the neutral position; Overhead-Arm = the arm that trained in the overhead position.
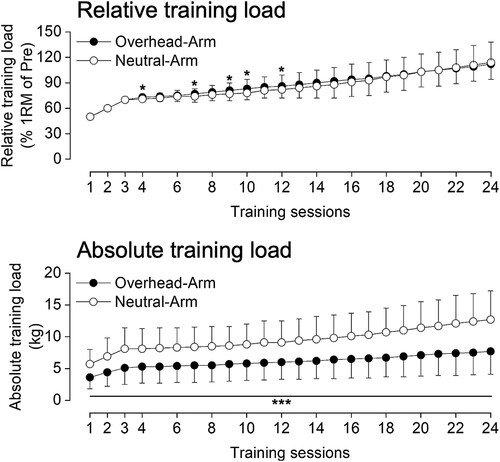
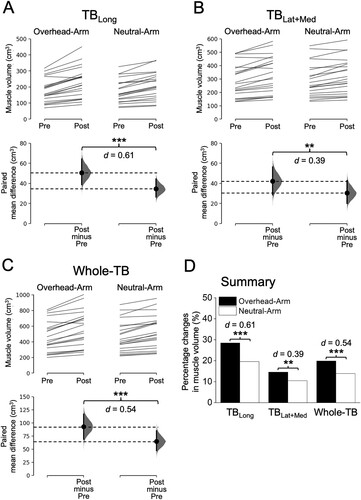
Figure 4. Changes in muscle volume of the TBLong (A), TBLat+Med (B), and Whole-TB (C) after the training. In each subfigure/muscle(s), the raw data is plotted on the upper axes for Overhead-Arm (left) and Neutral-Arm (right); each paired set of observations at Pre and Post is connected by a line. On the lower axes, each paired mean difference is plotted as a bootstrap sampling distribution. Mean differences are depicted as dots with horizontal dashed lines; 95% confidence intervals are indicated by the ends of the vertical error bars. ***P < 0.001 and **P < 0.01, difference between arms (conditions) based on a baseline-adjusted ANCOVA. d values indicate Cohen's d effect sizes of between-group differences based on absolute change values. The bar graphs in the summary figure (D) are based on the ANCOVA-adjusted mean changes for each muscle(s). TBLong = triceps brachii long head; TBLat+Med = triceps brachii lateral and medial heads; Neutral-Arm = the arm that trained in the neutral position; Overhead-Arm = the arm that trained in the overhead position; Whole-TB = whole triceps brachii.