Figures & data
Table 1. Genotype score of each polymorphism based on literature (TGS Model 1), and genotype frequencies in elite rugby athletes and non-athletes from Part 1.
Figure 1. Frequency distribution of TGS based on: (a) prior literature as calculated from (Model 1) Mean (SE) kurtosis statistics in all rugby athletes were −0.063 (0.201) and non-athletes was −0.130 (0.233). (b) Elite rugby athlete data as calculated from Supplementary Material Table 1 (Model 2). Mean (SE) kurtosis statistic in all rugby athletes was −0.320 (0.201) and non-athletes was 0.096 (0.233). (c) SNPs previously associated with elite status in rugby as calculated from Supplementary Material Table 2 (Model 3)Mean (SE) kurtosis statistic in All rugby athletes was −0.161 (0.201) and non-athletes was 0.296 (0.233). Non-athletes (n = 436), All rugby athletes (n = 589).
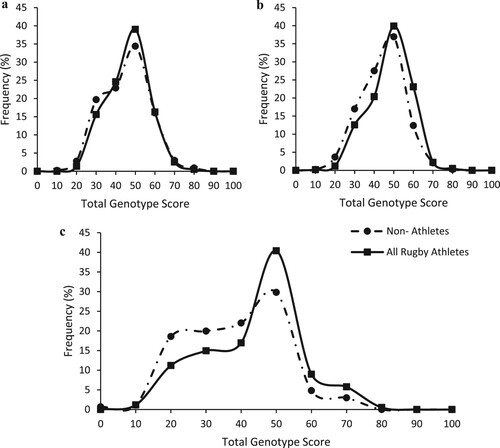
Figure 2. Receiver operating characteristic curve (ROC) summarising the ability of TGS to classify elite status in rugby from non-athletes AUC indicates the area under the curve (95% confidence intervals).
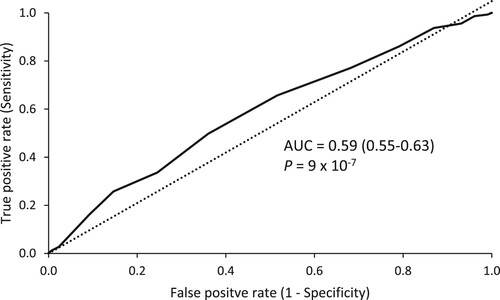
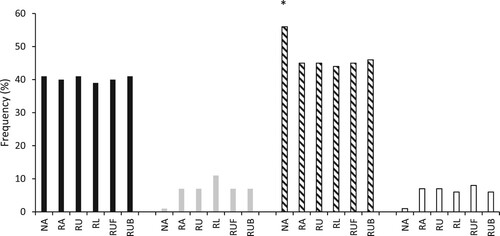
Figure 3. Inferred haplotype frequencies derived from COL5A1 rs12722 and rs3196378. Black bars = C-C, grey bars = C-A, diagonal line bars = T-A, clear bars = T-C. *different from all other groups (P < 0.022).