Figures & data
Table 1. Frequency (events per match) for each match characteristic by age category and playing standard.
Figure 1. Proportion of tackle characteristics by age category and playing standard; (A) Tackle type, (B) Active vs Passive Shoulder tackles, (C) Tackle Direction, (D) Point of Contact, (E) Sequencing, and (F) Attacker Intention.
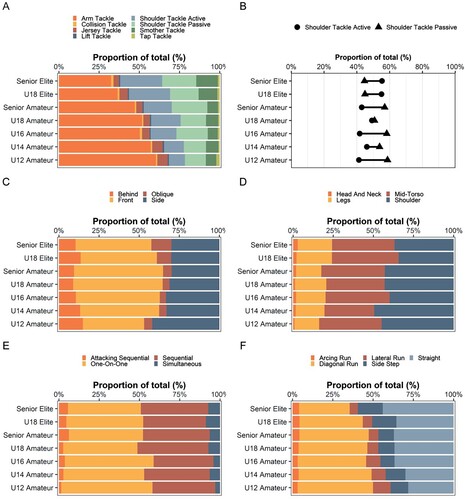
Table 2. Frequency of tackle activity in male rugby union by age category and playing standard.
Table 3. Frequency of ruck, maul, scrum and lineout activity by age category and playing standard.
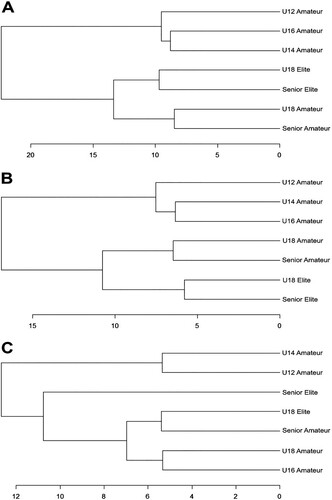
Figure 2. Hierarchical cluster analysis for (A) all match characteristics, (B) tackle characteristics and (C) ruck, maul, scrum and lineout characteristics, demonstration the overall differences and similarities of age categories and playing standards.
Notes: The discrete grouping of playing groups is indicated by the point at which they join, with the horizontal length of the line indicating the degree of difference. For example, in A, U18 and Senior Amateur are grouped and U18 and Senior Elite are grouped showing differences. At the next level, these 4 playing groups differ from the U12, U14 and U16 Amateur level.