Figures & data
Figure 1. Example of core temperature of a player during a field hockey match measured using a wearable temperature sensor (CORE; circles) and ingestible telemetric temperature pill (BodyCAP; squares) (Panel A); scatter plot of core temperature, with a solid black reference line to indicate perfect agreement (Panel B); and Bland Altman plot illustrating error between the devices (CORE – BodyCAP) as a function of mean core temperature for each time point, with mean bias shown by a dashed line, 95% limits of agreement shown by dotted lines and practically acceptable levels of error (±0.1°C) shown by the shaded area (Panel C).
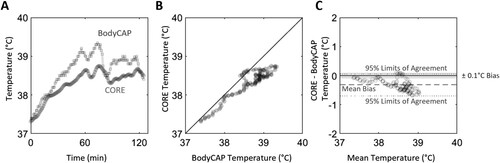
Figure 2. Average within-player agreement of core temperature measured using CORE and BodyCAP devices; scatter plot of core temperature, with a solid thin black reference line to indicate perfect agreement, and a thick black line indicating a locally estimated scatterplot smoothing (LOESS) regression line to illustrate non-linearity of bias; and Bland Altman plot illustrating error between the devices (CORE – BodyCAP) as a function of mean core temperature for each time point, with mean bias shown by a dashed line, 95% limits of agreement shown by dotted lines and practically acceptable levels of error (±0.1°C) shown by the shaded area.
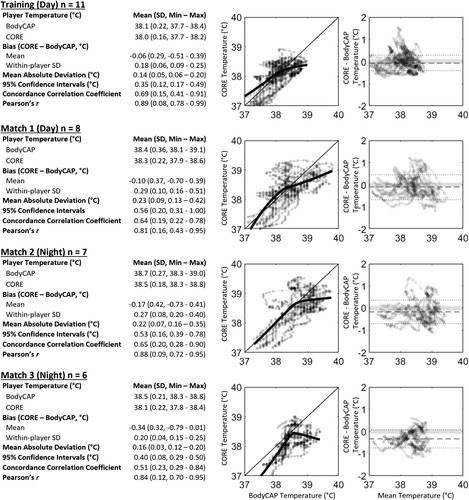
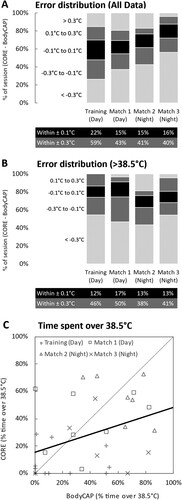
Figure 3. Proportion of error between devices (CORE – BodyCAP) within practically acceptable levels of error (±0.1°C), between 0.1°C to 0.3°C and greater than 0.3°C for all available data (Panel A) and data where core temperature estimated by the BodyCAP was greater than 38.5°C (Panel B). Tables for Panels A and B indicate the proportion of data points that error between the devices was ±0.1°C and ±0.3°C. Panel C illustrates a scatter plot of the proportion of time that each device estimated core temperature to be over 38.5°C for each player and session, with the thin black reference line indicating perfect agreement and thick black line indicating a regression line of best fit.