Figures & data
Table 1. Percentage of session elapsed when a significant change occurred in walking technique.
Figure 1. Change in walking kinematics across each walking session. (A) Anterior Trunk Flexion, (B) Lateral Trunk Flexion, (C) Plantar-Flexion Angle at Toe Off, (D) Ankle Velocity, (E) Knee Flexion During Stance, (F) Step Length, (G) Step Width, and (H) Cadence. ○ Moderate Walking, ● Moderate Walking + BFR, □ Fast Walking, ▪ Fast walking + BFR Data are presented as mean with corresponding 95% confidence intervals displayed. All data allocated a percentage representing the amount of session elapsed when collected before being assigned to the nearest 10 percent timepoint.
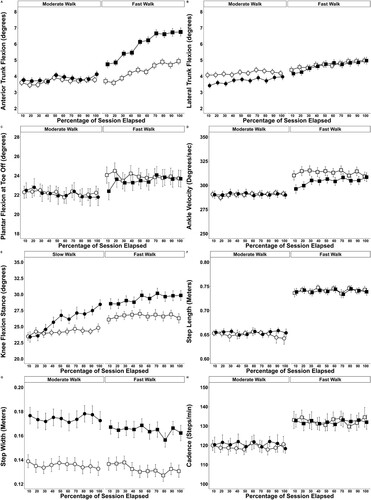
Figure 2. Markers of anaerobic metabolism, membrane potential and breakdown are represented by (A) Blood lactate Concentration, (B) Lactate Dehydrogenase, (C) Creatine Kinase, (D) Sodium, (E) Potassium, and (F) Chloride. ○ Moderate Walking, ● Moderate Walking + BFR, □ Fast Walking, ▪ Fast walking + BFR Data are presented as collection point means with corresponding 95% confidence intervals are displayed. a Significantly different to all sessions, # Significantly different to pre-exercise.
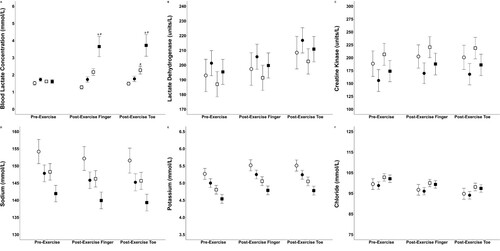
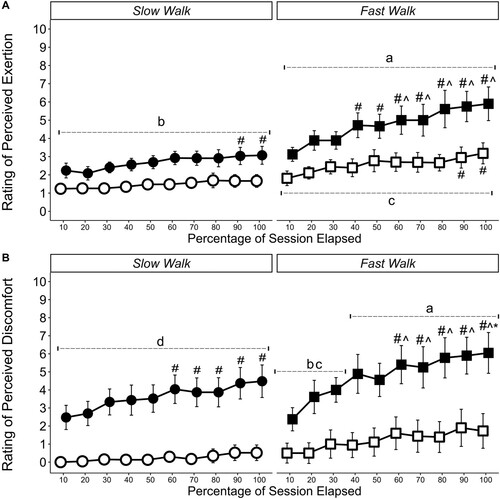
Figure 3. Ratings of (A) Perceived Exertion and (B) Perceived Discomfort. ○ Moderate Walking, ● Moderate Walking + BFR, □ Fast Walking, ▪ Fast walking + BFR Data are presented as time point means with corresponding 95% confidence intervals are displayed. The scale ranged from 0 (rest/no discomfort) to 10 (maximal exertion or discomfort an individual had experienced during aerobic exercise). a Significantly different to all sessions b Significantly different to the unrestricted equivalent session, c Significantly different to unrestricted moderate walk, d Significantly different to both unrestricted sessions # Significantly different to 10 percent time point, ^ Significantly different to 30 percent time point, * Significantly different to 50 percent time point.