Figures & data
Figure 1. (a) Absolute distance covered within different speed categories during whole match time, ball-in-play (BIP) and ball-out-play (BOP) time, (b) Distance covered within different speed categories as a percentage of total distance covered during whole match time, ball-in-play and ball-out-play time and (c) Within each speed category, the percentage of whole match distance covered during either ball-in-play or ball-out-play time. Data are the mean of 2166 team performances (expressed as the average per outfield player) during 1083 matches.
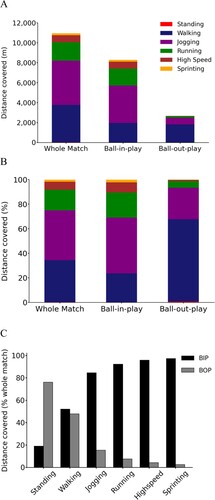
Table 1. Physical metrics during the whole match, ball-in-play and ball-out-play time, expressed in absolute terms (m) and rate of distance covered (m·min−1) for specific speed categories and the total of all speed categories.
Figure 2. (a) Rate of distance covered within different speed categories during whole match time, ball-in-play and ball-out-play time, (b) Rate of distance covered during the whole match within different speed categories, percentage difference compared to the rate of distance covered during ball-in-play (whole match rates > ball-in-play rates, positive values; whole match rates < ball-in-play rates, negative values). Date are the mean of 2166 team performances (expressed as the average per outfield player) during 1083 matches.
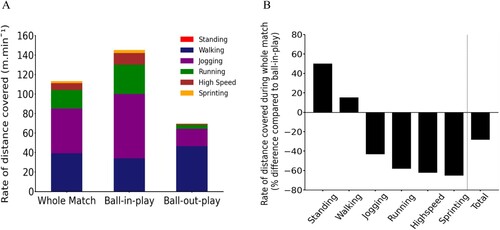
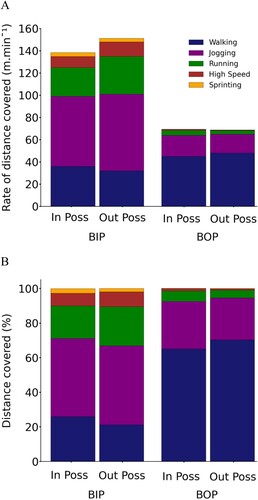
Figure 3. (a) Rate of distance covered within different speed categories when in and out of possession during both ball-in-play (BIP) and ball-out-play (BOP) time, and (b) Distance covered within different speed categories as a percentage of total distance covered when in and out of possession during both ball-in-play and ball-out-play time. Standing values were consistently negligible and thus were excluded from the rate of TDC. Data are the mean of 2166 team performances (calculated as the average per outfield player) during 1083 matches. Abbreviations: In Poss = in possession; Out Poss = out of possession.