
Figures & data
Table 1. Baseline characteristics of participants (N = 308).
Figure 1. Multivariable mixed effects model for estimated leg muscle strength and balance measures with 95% CIs at baseline and five-year follow-up for pre-specified values of baseline MVPA. Baseline MVPA was standardised and pre-specified values were 0 and 1 standard deviation (SD). The coefficient for the interaction between baseline MVPA and follow-up time was demonstrated by the difference between the two slopes (black and gray solid lines), that is, the difference in the five-year change of the outcome for one-SD increase of baseline MVPA. The coefficient for baseline MVPA was demonstrated by the difference in estimated values at baseline (black and gray points at year 0). The models included baseline MVPA, follow-up time, and the interaction between baseline MVPA and follow-up time, adjusted for baseline age, weight (including its interaction with time), height, education, employment, marital status, smoking, menopausal status, serum 25-hydroxyvitamin D levels and baseline sedentary time.
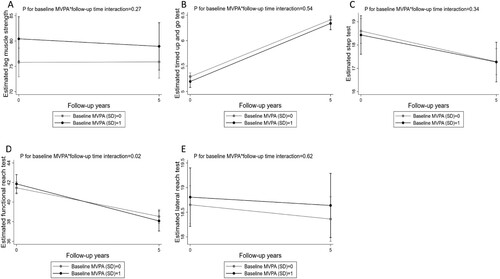
Figure 2. Multivariable mixed effects model for estimated leg muscle strength and balance measures with 95% CIs at baseline and five-year follow-up for pre-specified values of 5-year change in MVPA. 5-year change in MVPA was standardised and pre-specified values were 0 and 1 standard deviation (SD). The coefficient for the interaction between 5-year change in MVPA and follow-up time was demonstrated by the difference between the two slopes (black and gray solid lines), that is, the difference in the five-year change of the outcome for one-SD increase of 5-year change in MVPA. The coefficient for 5-year change in MVPA was demonstrated by the difference in estimated values at baseline (black and gray points at year 0). The models included 5-year change in MVPA, follow-up time, and the interaction between 5-year change in MVPA and follow-up time, adjusted for baseline age, weight (including its interaction with time), height, education, employment, marital status, smoking, menopausal status, serum 25-hydroxyvitamin D levels and 5-year change in sedentary time.
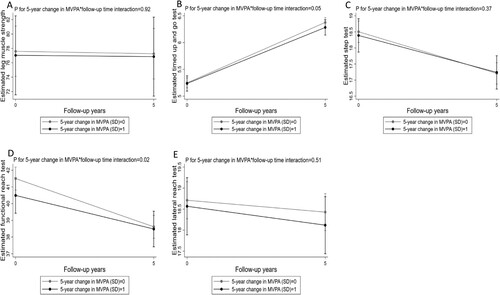
Table 2. Associations between sedentary time and time spent in light physical activity and in MVPA with 1-year incident/injurious/multiple falls.