Figures & data
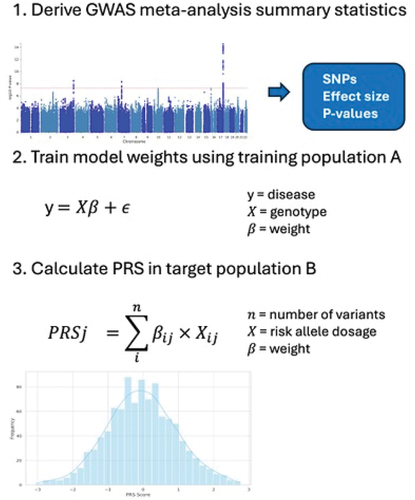
Figure 1. A) Genome-wide association study (GWAS) providing disease association summary statistics. An example Manhattan plot is shown, where the dashed line represents the threshold for genome-wide significance. B) Training (optimization) of the PRS based on GWAS summary association results in a dataset that is independent of the GWAS dataset. C) Calculation of the optimized PRS in target population.