Figures & data
Figure 1. On the left panel, stimuli used in the experimental tasks. All stimuli were flipped horizontally, resulting in 24 unique images (12 non-social and 12 social, 12 high threats and 12 low threats). On the right panel, ratings of Arousal, Dangerousness, and Unpleasantness provided by an independent sample (N = 24). Error bars represent the standard deviation from the mean. *** p < .001.
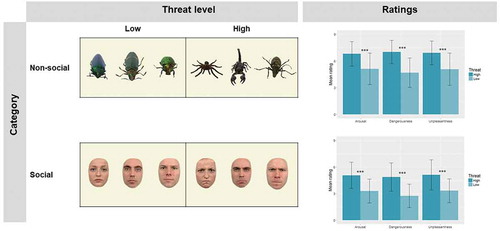
Figure 2. (a). Schematic representation of the fMRI task, wherein participants passively viewed non-social and social stimuli of different threat levels move towards (Approach) or away (Withdrawal) from them, and rated their discomfort level. Non-social condition is displayed. (b). Schematic representation of the computerized distance task, wherein participants manipulated the distance from social and non-social stimuli by adjusting their size on the screen. Non-social condition is displayed. (c). Behavioral responses in the computerized distance task showed greater distances for high relative to low threat stimuli, and for non-social relative to social stimuli. *** p< .001.
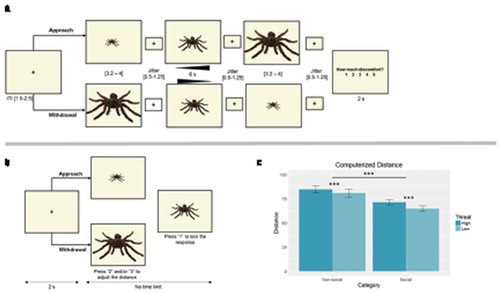
Table 1. Descriptive statistics (mean and standard deviation in brackets) for discomfort ratings during the fMRI task, distance in the computerized task, and preferred distance (m) in the “Stop-distance” task. Discomfort ratings were provided in a 1–5 scale; distance in the computerized task was operationalized as the inverse of the percentage of maximum image size (such that values vary from 0 to 100 and greater values represent greater distance); distance in the “stop-distance” task is provided in meters.
Table 2. Brain regions displaying greater activation for moving (A) and static (B) social relative to non-social stimuli, and non-social relative to social stimuli, controlling for level of discomfort. (FDR p < .05; MNI coordinates of the peak voxel are reported).
Table 3. Brain regions displaying greater activation for Approach > Withdrawal, and Withdrawal > Approach (A), and results of the conjunction analyses (B) (FDR p < .05; MNI coordinates of the peak voxel are reported).
Figure 3. (a). Brain regions showing increased activation for social relative to non-social stimuli (left), and for non-social relative to social stimuli (right), irrespective of threat level and direction of movement. (b). Brain regions showing increased activation for social relative to non-social stimuli (left), and to non-social relative to social stimuli (right), irrespective of threat level and distance. TPJ = temporoparietal junction; FFA = face fusiform area; MPFC = medial prefrontal cortex. Activation threshold set at cluster-forming p< .001 uncorrected, and FDR-corrected p< .05 at the cluster level. Results in the figure are displayed at p< .005 uncorrected for visualization purposes, but only clusters surviving at the predefined threshold are highlighted.
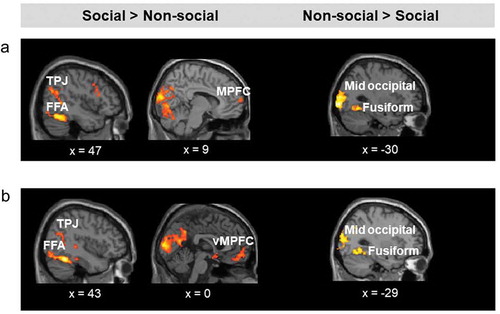
Figure 4. (a). Brain regions showing increased activation for approaching relative to withdrawing stimuli (left), and for withdrawing relative to approaching stimuli (right), irrespective of stimulus category and threat level. (b). Left: Results of the conjunction analysis showing the overlap on the midbrain between (non-social threats approach > withdrawal) and (social threats approach > withdrawal). Right: Results of the conjunction analysis showing the overlap on the vlPFC between (non-social threats withdrawal > approach) and (social threats withdrawal > approach). PMv = ventral premotor cortex; SPL = superior parietal lobule; vlPFC = ventrolateral prefrontal cortex (*significant at p< .005 uncorrected, FDR-corrected p< .05); PCC = posterior cingulate Activation threshold set at cluster-forming p< .001 uncorrected, and FDR-corrected p< .05 at the cluster level. Results in the figure are displayed at p< .005 uncorrected for visualization purposes, but only clusters surviving at the predefined threshold are highlighted.
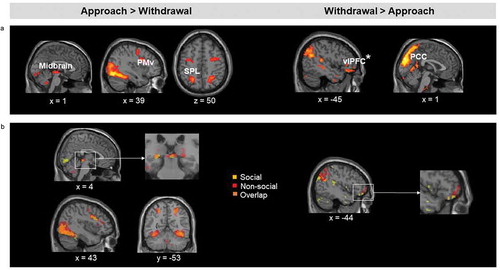
Table 4. Brain regions displaying greater activation for Near > Far, and Far > Near (FDR p < .05; MNI coordinates of the peak voxel are reported).
Figure 5. (a). Brain regions showing increased activation for near relative to far stimuli (left), and for far relative to near stimuli, irrespective of stimulus category and threat level. (b). Left: Results of the conjunction analysis showing the overlap on the midbrain between (non-social threats near > far) and (social threats near > far). Activation threshold set at cluster-forming p< .001 uncorrected, and FDR-corrected p< .05 at the cluster level. Results in the figure are displayed at p< .005 uncorrected for visualization purposes, but only clusters surviving at the predefined threshold are highlighted.
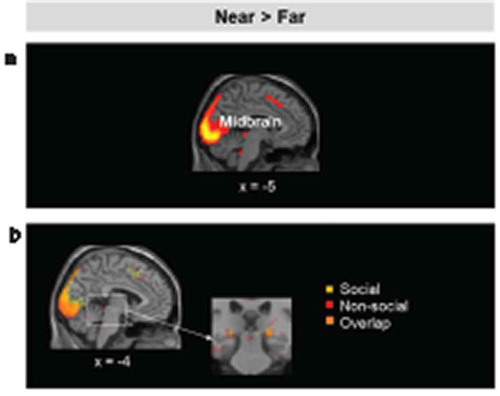
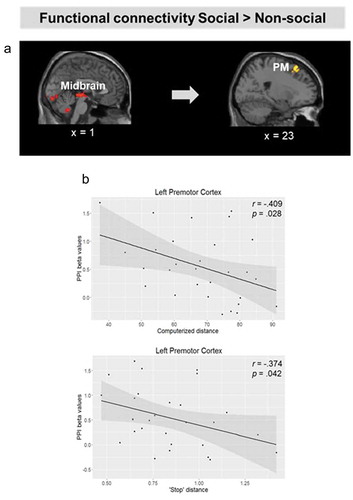
Table 5. Results of the PPI analysis, showing brain regions with increased functional connectivity with the midbrain PAG in response to approaching social versus non-social stimuli (FDR p < .05; MNI coordinates are reported).
Figure 6. (a). Brain regions showing increased functional connectivity with the midbrain for approaching social relative to non-social stimuli. (b). Scatter plot depicting the correlation between preferred distance to social stimuli in the computerized task, and connectivity strength between the midbrain and the left PMd. Activation threshold set at cluster-forming p< .001 uncorrected, and FDR-corrected p< .05 at the cluster level. Results in the figure are displayed at p< .005 uncorrected for visualization purposes, but only clusters surviving at the predefined threshold are highlighted.