Figures & data
Table 1. A description of the unfamiliar hand actions performed in the videos and performed by the participants in the execution group.
Figure 1. Percentage change from pre- to post-test for hand action observation and static hand observation in a) central alpha, b) occipital alpha, c) central beta, and d) occipital beta power for both training groups.
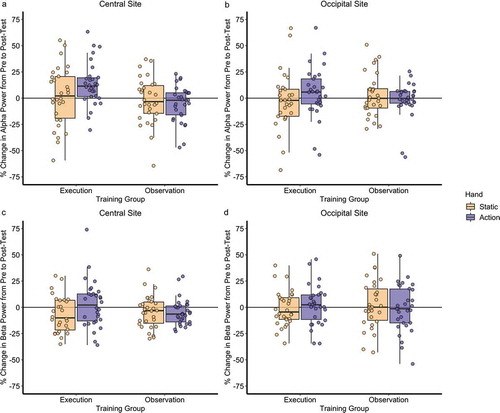
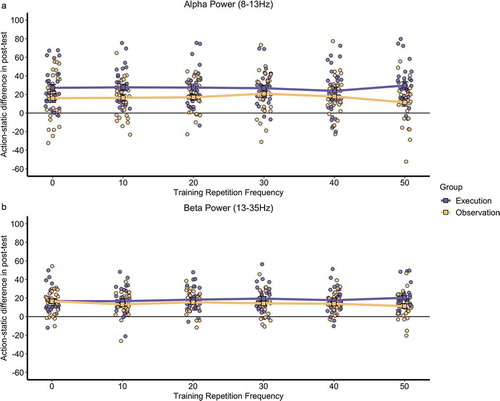
Figure 2. Mean action-static difference across the central electrodes in the post-training task for each training repetition frequency for both training groups in a) alpha and b) beta power. The square point represents the mean data for each training repetition frequency by training group and the circle point represents individual data.