
Figures & data
Figure 1. Outline of the entire fMRI experiment. First, the participant moved to the MRI room and had the first fMRI run (pre-run). Immediately after the first fMRI session, the participant moved to the soundproofed room to carry out the intervention. The participants assigned to the DIFF and SAME groups engaged in a 30-minute intervention task. Participants assigned to the CONT group took a 30-minute break. The intervention task involved making a constructive speech for a contentious issue using a designated point of view. The contrary point of view was required for the DIFF group and the original viewpoint was required for the SAME group. Lastly, the participant moved to the MRI room again and completed the second fMRI run (Post-run).
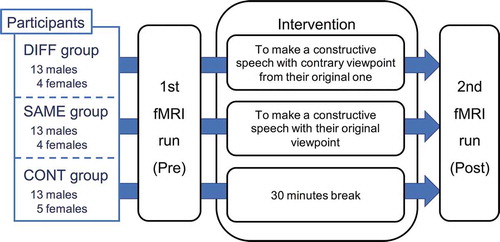
Figure 2. Details of the fMRI experimental task design. (a) Example of a visual stimulus for the Judgment task. Note that the original stimuli were written in Japanese. In this example, the word in yellow font (Smoking) indicates a contentious issue. The sentence in white font shows the reason why another person (the other) is taking a specific viewpoint on the issue in two to four lines. Participants read the reason and judged whether they approved of the other’s argument. (b) An example of a visual stimulus for the Control task. A simple letter of the alphabet (e.g., issue a) is used instead of the title of the issue. An affirmative or opposing statement is described in the sentence in place of the reason in (a). The details of the stimulus are the same as those in the Judgment task. (c) Timeline of each fMRI run. The duration of each trial was 6 seconds, and the inter-trial interval was set at 1–3 seconds. The order of each Judgment and Control task trial was counterbalanced.
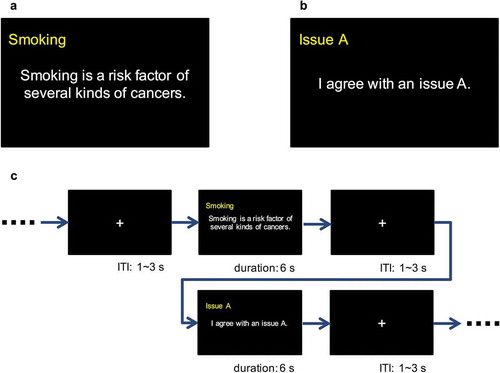
Table 1. The average (SD) reaction time (RT) [s] and the degree of coincidence with common-sense interpretation of the Judgment task and the degree of correct interpretation of the control task in the CONT, SAME, and DIFF groups.
Table 2. Regions showing significantly different activation for the DIFF and SAME groups after experiencing intervention (Post-DIFF > Post-SAME).
Figure 3. Results of the fMRI analysis. Regions showing significant activations associated with the Judgment task specific to the DIFF group on Post-run (Post-DIFF > Post-SAME; p < 0.05, corrected for FWE by voxel level inference): (a) right middle orbital gyrus, (b) right middle frontal gyrus, (c) left middle frontal gyrus, (d) right middle temporal gyrus, (e) right inferior parietal lobule, and (f) right cerebellum. Those activations were overlayed on the Colin27 template that was provided by MRIcron software (http://people.cas.sc.edu/rorden/mricron/index.html). The color-bar indicates the t-value for each activation.
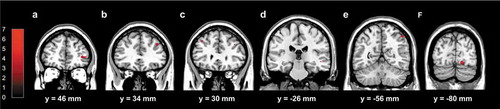
Figure 4. Results of the ROI analysis. (a) Definition of ROIs: three activation clusters on the right parieto-frontal network that were obtained by the subtraction analysis of the Post-DIFF > Post-SAME on the second level were used. The color-bar indicates the t-value for each activation. The box-and-whisker plots depict the distribution of parameter estimates of “Judgment – Control” on Post-run for each group (e.g., Post-CONT, Post-SAME, and Post-DIFF, respectively) in (b) the right inferior parietal lobule, (c) the right middle frontal gyrus, and (d) the right middle orbital gyrus. (e) Relationship between the activation profile of the right middle orbital gyrus and the stubbornness score. The dotted line indicates the regression line between them.
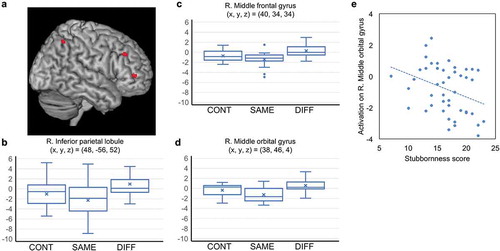
Table 3. Results of partial correlation analysis between the activation profile of each ROI and stubbornness scores.