Figures & data
Figure 1. The five scenarios build a gradient of utilitarian response in a 4-point response scale
Table 1. Descriptive statistics: Mean and SD of utilitarian response
Figure 2. a) Distribution of participant slopes. The frequency represents responses to each individual dilemma, where each participant delivered 5 responses. The slope −.2 was not represented in any participant. The slope .7 was represented in a participant with no HF data. b) Mean tonic and phasic HF as a function of participant slope and high (N = 129 responses) vs. low (N = 122 responses) tonic group. Groups were based on the median split of log10 transformed tonic HF, after subtracting 105 data points from responses where participants took <6.7 sec
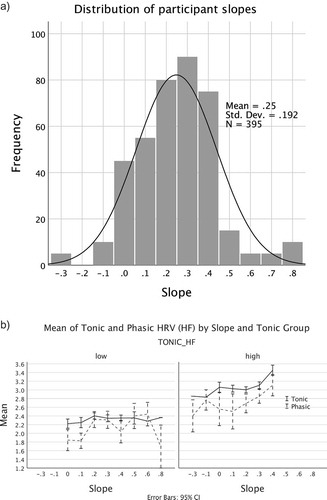
Figure 3. Perception of the utilitarian gradient as a function of level of tonic HF