3,350
Views
0
CrossRef citations to date
0
Altmetric
Research paper

Desensitized gamers? Violent video game exposure and empathy for pain in adolescents – an ERP study

ORCID Icon, , &
Pages 365-381 | Received 26 May 2023, Published online: 24 Nov 2023

Figures & data

Figure 1. Example of stimuli used in the task (Meng et al., Citation2012; Meng et al., Citation2023) (A and B); example of an EEG trial in the pain judgment task (C).

Note. Each trial started with a fixation cross (400 ms), followed by a black screen interval of 600–1200 ms (in steps of 200 ms) in order to minimize time-locked anticipatory processes. In the ERP blocks, the pictures were presented for 500 ms in a randomized order (Ikezawa et al., Citation2014) and in the behavioral rating block – for 1000 ms. Picture presentation was followed by a black screen with a white “respond” word in the middle until a response was given. Before the start of the next trial, a black screen appeared (200 ms).
Figure 1. Example of stimuli used in the task (Meng et al., Citation2012; Meng et al., Citation2023) (A and B); example of an EEG trial in the pain judgment task (C).

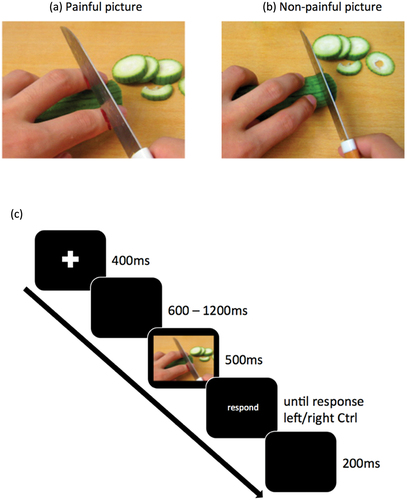
Table 1. Main and interaction effects for the behavioral pain rating.

Figure 2. Grand average ERP waveforms averaged across 6 electrodes with marked time windows for the P3 and the LPP components: (A) pre-game condition, (B) post-game condition.

Figure 2. Grand average ERP waveforms averaged across 6 electrodes with marked time windows for the P3 and the LPP components: (A) pre-game condition, (B) post-game condition.

Table 2. Main and interaction effects for the P3 component.

Figure 3. P3 amplitude as a function of Time (pre-game vs. post-game) and pain (painful vs. non-painful pictures).

Note. The main effect of pain was significant both in the pre-game and in the post-game conditions, but overall (across conditions) it was not significant (see text).
Figure 3. P3 amplitude as a function of Time (pre-game vs. post-game) and pain (painful vs. non-painful pictures).

Table 3. Main and interaction effects for the LPP component.

Figure 4. LPP amplitude as a function of Time (pre-game vs. post-game) and pain (painful vs. non-painful pictures).

Note. Significant effects of Pain and Time were found in both the pre- and post-gameplay measurements. In addition, a significant drop in LPP amplitude for painful pictures was observed from pre- to post-game measurements, while no significant changes were observed for the LPP amplitude for the non-painful pictures before and after playing the game.
Figure 4. LPP amplitude as a function of Time (pre-game vs. post-game) and pain (painful vs. non-painful pictures).

Table 4. Main and interaction effects for the P3 component with C-ME as a covariate.

Figure 5. Visualization of the Time x pain x C-ME interaction for P3.

Note. C-ME moderated the level of P3 painful amplitudes before the game, but not after the game.
Figure 5. Visualization of the Time x pain x C-ME interaction for P3.
Supplemental material

SNS-RP 32.23_Suppl_Mats_Clean.docx

Download MS Word (440.4 KB)