Figures & data
Figure 1. Flow diagram of the process for study selection. aFor the Google Scholar search, only the most relevant records were retained, as n = 44,217 for the total-identified records
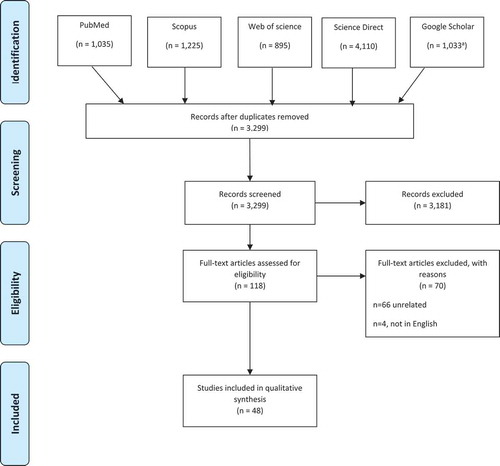
Table 1. Beta-thalassemia HBB gene mutations unique to Arabs
Table 2. Beta-thalassemia common mutations in the HBB gene among Arab countries shared with other ethnic groups
Figure 2. Distribution of HBB mutations in Arab countries. The green color indicates Arab countries. The mapping was limited to the most common and unique mutations only, the entire list of mutations are list in Supplementary : Beta-thalassemia HBB gene shared mutations between Arabs and other ethnic groups Note: The map is extracted from the free map product (http://english.freemap.jp/item/africa/africa_1.html)/Africa’s regional Thumbnail, under the Creative Commons Attribution 3.0 unported (CCBY3.0) license
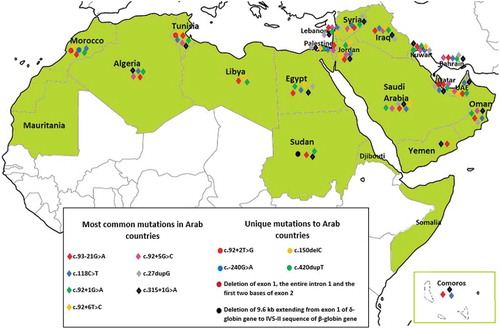
Figure 3. Types of HBB gene mutations associated with β-thal in the Arab countries
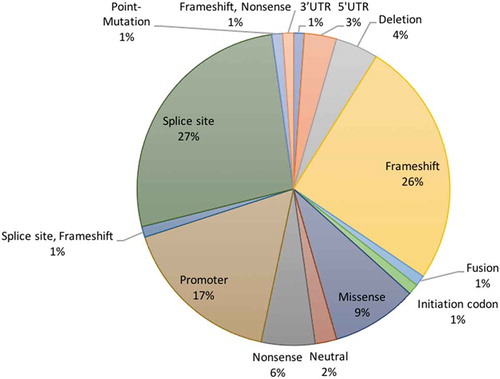
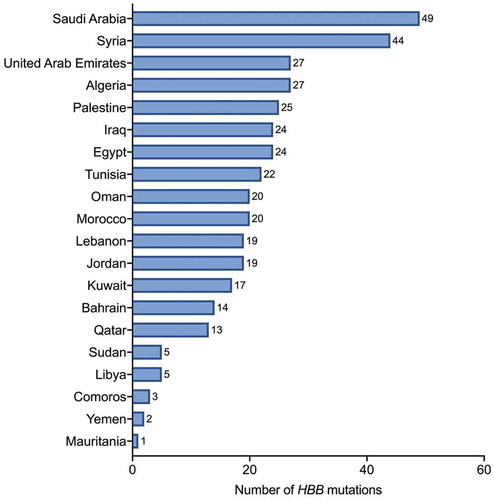
Figure 4. Number of HBB mutations identified in each Arab country