Figures & data
Figure 1. The many faces of CRISPR/Cas gene editing. The activated CRISPR/Cas9 complex can modified cell behavior in a variety of ways. These include deletion of sections of genomic DNA, the insertion or replacement of segments of the genome (viewed as being traditional genomic gene editing), modification of gene expression where in the complex functions as a repressor or activator of transcription and modulation of chromatin structure using effector domains of remodeling enzymes. dCas9 refers to a Cas nine protein that is devoid of double-strand DNA breakage, while Nickase refers to a Cas9 protein where in only one of the two DNA cleavage domains of Cas9 is active. This results in the making of a single strand of the helix
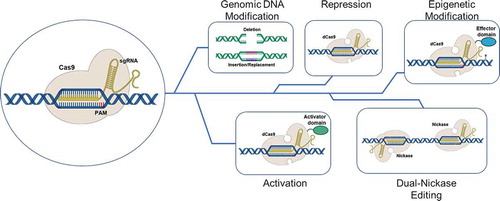
Table 1. Outline of Target Sites for Cas9-mediated Immune Checkpoint Inhibition in T-cells
Figure 2. Method for knockout of PD-1 in T cells. PBMCs were isolated from patient blood samples, and T cells were further isolated from the PBMC population by FACS. Isolated naïve T cells were targeted via liposome-based transfection with a CRISPR construct plasmid and a GFP reporter. Successfully transfected cells were pooled and activated with a weak activation factor, and allowed to expand for several days. After expansion and confirmation of cytotoxic potential, the activated cells, tumor infiltration capacity was analyzed in 3D culture
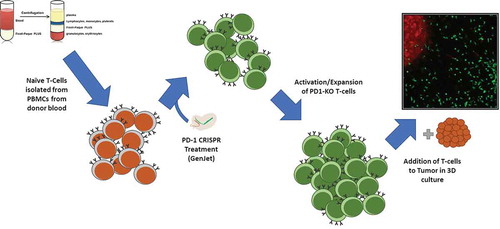
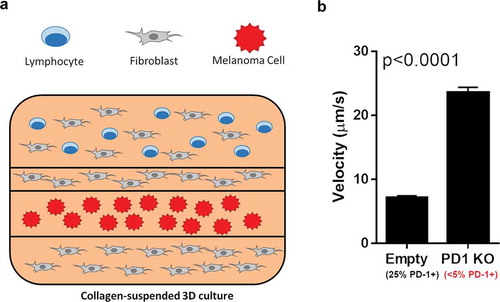
Figure 3. 3D culture-based infiltration assay outline. (A) Fluorescence-labeled T cells were suspended in a collagen matrix, layered with fibroblasts and labeled melanoma cells in the displayed layered 3D culture. This culture was live imaged over the course of 72 hours, with the migration vector and velocity of the T-cells recorded. (B) After 72 hours, the overall velocity of the T cells with and without PD-1 knockout were analyzed. Mock-transfected cells exhibited surface PD-1 on approximately 25% of cells, while PD1-KO cells showed surface PD-1 on less than 5%. An increase in tumor infiltration velocity of over 3x was seen between mock-transfected and PD-1 KO T cells