
Figures & data
Figure 1. Flow chart of study selection.
Figure 2. BP indices in SCD patients versus controls, (a) = systolic BP, (b) = diastolic BP, (c) = mean arterial pressure; (d) = Pulse rate, (e) = Pulse pressure.
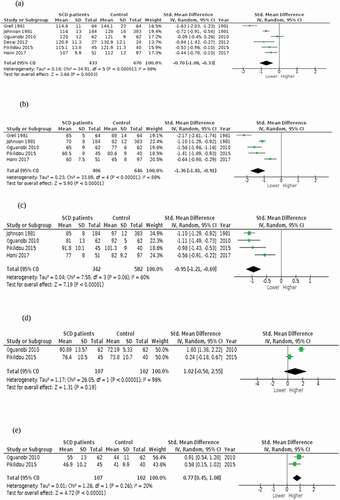
Table 2. Characteristics of included studies
Table 1. Risk of bias in the included studies