
Figures & data
Figure 1. Flowchart of the study.
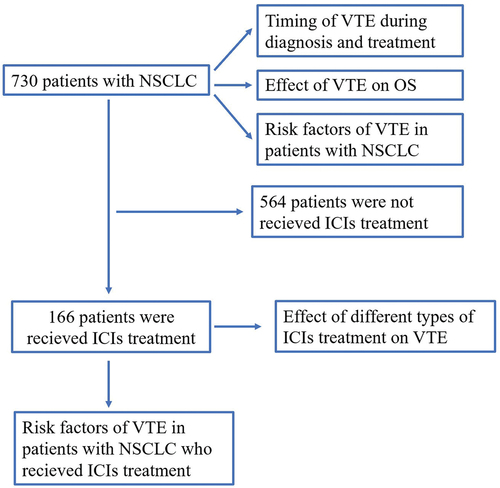
Table 1. The clinical characteristics of patients with NSCLC.
Figure 2. The risk factors for VTE in patients with NSCLC. X- axis represents the odds ratio (OR).Y-axis represents the risk factors.
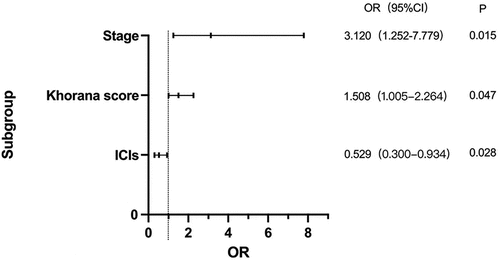
Table 2. The risk factors of VTE in patients with NSCLC.
Figure 3. The timing of VTE during diagnosis and treatment in patients with NSCLC. X axis represents the occurrent time of VTE during diagnosis and treatment; Y-axis represents the number of NSCLC patients with VTE.
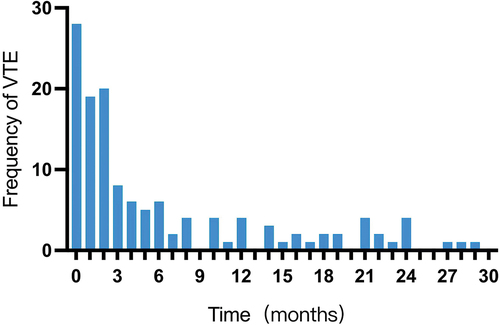
Figure 4. The analyze of overall survival for NSCLC patients between VTE group and non-VTE group. X axis represents the occurrent time of VTE; Y-axis represents the survival rate.
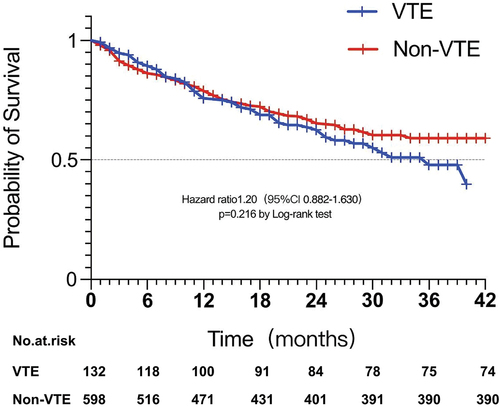
Table 3. The analysis of the number of cases of survival and death in NSCLC patients between VTE group and non- VTE group at 12, 24 and 36 months.
Table 4. The clinical characteristics of NSCLC patients who received ICIs treatment.
Figure 5. The risk factors of VTE in patients with NSCLC who received ICIs treatment. X-axis represents the odds ratio (OR), Y-axis represents the risk factors.
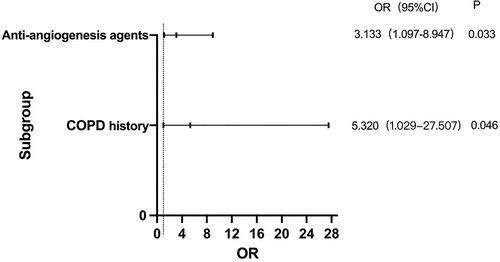
Table 5. The risk factors of VTE in patients with NSCLC who received ICIs treatment.
Table 6. Correlation analysis between different types of ICI and VTE in NSCLC patients who received ICIs treatment.