
Figures & data
Table 1. Overview of current guidelines for management of opioid-induced constipation.
Table 2. Overview of studies comparing proposed simple guidelines to standard guidelines.
Figure 1. Proposed simplified recommendations for the management of opioid-induced constipation. See text for elaboration.
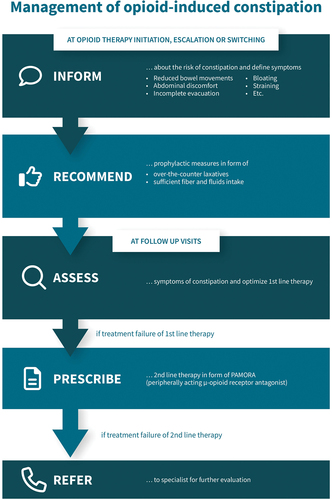
Figure 2. Biggest challenges and unmet needs of current OIC guidelines. On the left, percentage of healthcare practitioners reporting specific issues with the current guideline is displayed. On the right, ability of the new simplified recommendations to improve individual issues is shown.
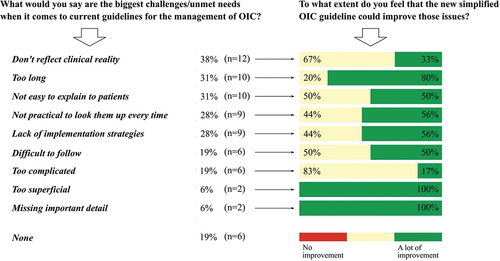
Figure 3. Individual scores regarding the credibility, clarity, relevance, and usability of the current guideline and new simplified recommendations. Each domain was rated by healthcare practitioners (n = 52) on a 7-point Likert scale ranging from 1 (not at all) to 7 (very). Mean and standard deviation (SD) are shown to the right. **p < 0.01, ***p < 0.001.
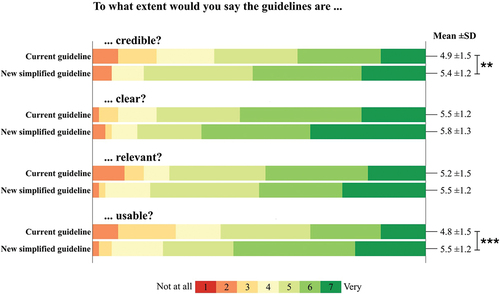
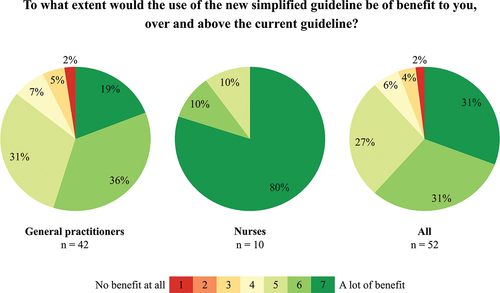
Figure 4. Pie charts displaying perception of the benefit of the new simplified recommendations, over and above the current guideline.
Data availability statement
The data presented in this study are available on request from the corresponding author.