Figures & data
Figure 1. Overview figure with outlines of the two MODIS tiles (thick lines) and the Landsat images (thin line).
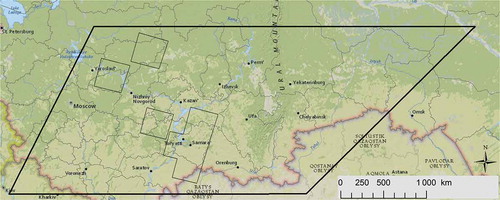
Figure 2. Overview of the methodology in four steps.
Table 1. Overview of Landsat images
Figure 3. Land surface phenology model for one grid cell in southern Samara. In this grid cell, the start of the growing season occurred on day 120 (DOY). The thermal time to peak was 2008 growing degree days and the height of the peak was 0.6975. Adapted from de Beurs and Henebry (Citation2008a).
Table 2. Confusion matrix for the Landsat classification results of all seven path/row combinations
Table 3. Overview of the Landsat classification accuracy for the three subregions
Figure 4. Output of the Landsat classification for Samara oblast.
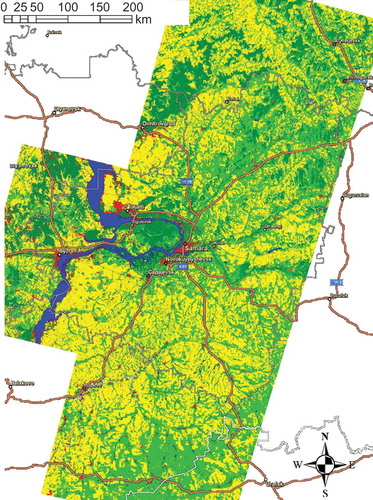
Table 4. Significant parameter estimates for the logistic regression model to identify cropland
Figure 5. Predicted agriculture based on the logistic model developed in this article.
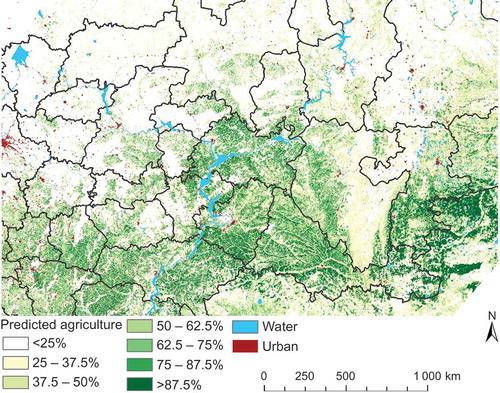
Figure 6. (a) MOD12 IGBP land cover map highlighting croplands only. (b) MERIS indicating three cropland classes. (c) Cropland probability according to the global cropland extent map by Pittman et al. (Citation2010).
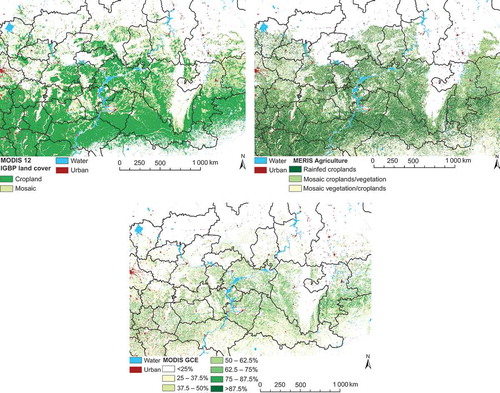
Figure 7. MODIS croplands, MERIS croplands, global cropland extent from Pittman et al. (Citation2010) and our arable land estimates for all rayons incorporated in the study. Linear line is the 1:1 line. Model estimates are in .
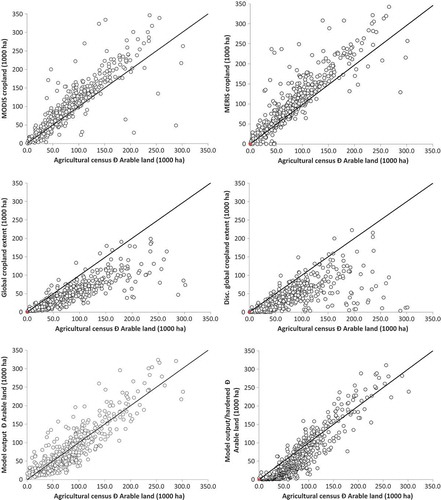
Table 5. Regression results with agricultural census statistics
Table 6. Confusion matrix for the four different satellite products, including the data created by logistic models as presented in this article
Table 7. Regression statistics of the successfully sown analysis. Samara oblast only
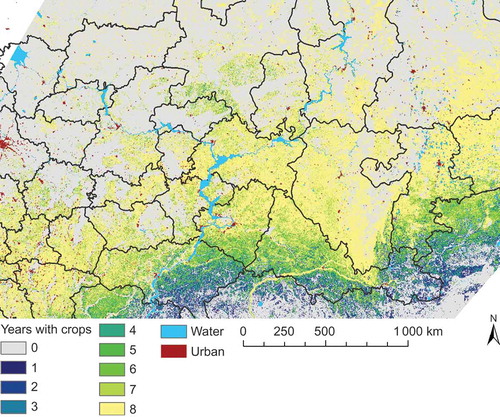
Figure 8. The number of years with crops between 2002 and 2009. Yellow pixels are cropped every year during the 8-year period from 2002–2009. Other colours indicate at least one fallow year during this period. There is a north–south gradient, with pixels in the south indicating more fallow years than northerly pixels.