
Figures & data
Figure 1. Map of the MAP region with major roads superimposed. This region encompasses the tri-national frontier regions of the Peruvian state of Madre de Dios (capital city, Puerto Maldonado), the Brazilian state of Acre (capital city, Rio Branco), and the Department of Pando (capital city, Cobija), Bolivia.
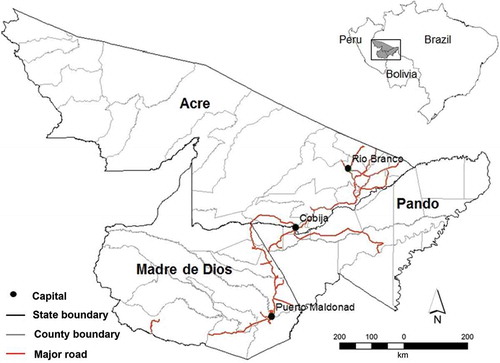
Figure 2. Forest/non-forest maps showing fragmentation dynamics in the MAP region for the year of (a) 1986, (b) 1991, (c) 1996, (d) 2000, (e) 2005, and (f) 2010, interpreted from eight Landsat imageries (path/row: 1/67, 1/68, 2/67, 2/68, 2/69, 3/67, 3/68, 3/69).
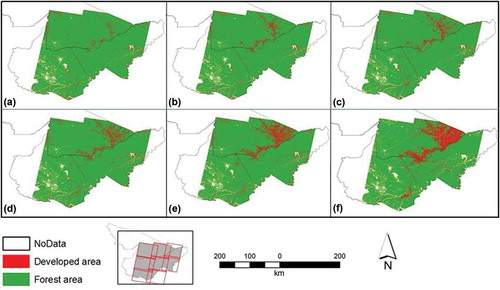
Figure 3. A hypothesized landscape (spatial resolution, 30 m) was convoluted by nine different filters, ranging from 5 × 5 to 537 × 537 pixels, and these such nine filtered maps were then stacked to produce a multi-band layer stack image and to then run an ISO classification with user-defined cluster numbers (five clusters here from c1 to c5).
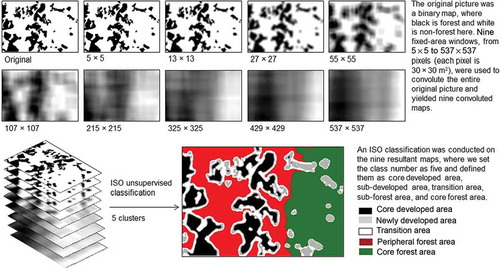
Table 1. Summary of forest and non-forest areas from 1986 to 2010 in the MAP region*.
Figure 4. The results of the ISO clustering analysis in the MAP region from 1986 to 2010, using the migrating means clustering algorithm (also known as the ISO cluster) which is based on the similarity of Pn (fragmentation proportion) within nine window sizes. (a) 1986, (b) 1991, (c) 1996, (d) 2000, (e) 2005, and (f) 2010.
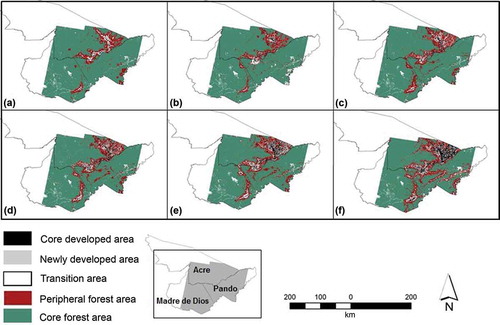
Table 2. Summary of ISO cluster analysis in percentage from 1986 to 2010 in the MAP region*.
Figure 5. The profiles of ISO cluster means along multiple window sizes in Acre, Brazil, from 1986 to 2010. X-axis is the side length of different windows (unit, km) and Y-axis is Pn (fragmentation proportion within each window). (a) 1986, (b) 1991, (c) 1996, (d) 2000, (e) 2005, and (f) 2010.
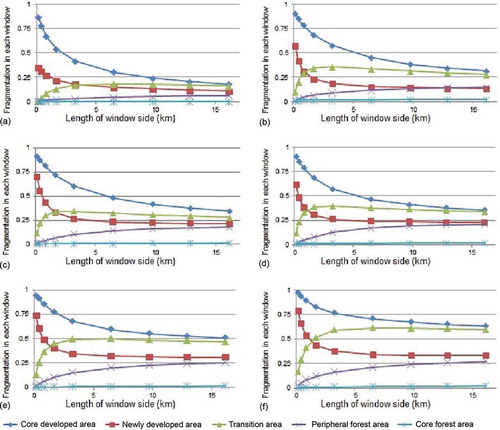
Figure 6. The profiles of ISO cluster means along multiple window sizes in Pando, Boliva, from 1986 to 2010. X-axis is the side length of different windows (unit, km) and Y-axis is Pn (fragmentation proportion within each window). (a) 1986, (b) 1991, (c) 1996, (d) 2000, (e) 2005, and (f) 2010.
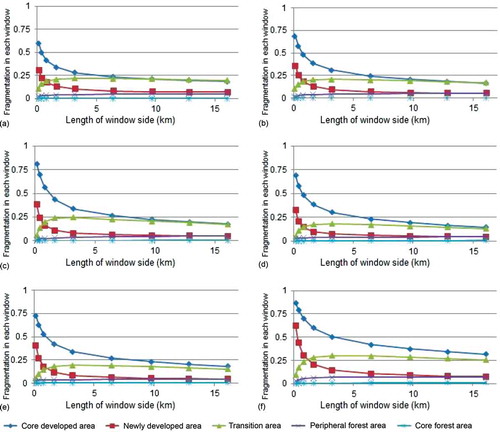
Figure 7. The profiles of ISO cluster means along multiple window sizes in Madre de Dios, Peru, from 1986 to 2010. X-axis is the side length of different windows (unit, km) and Y-axis is Pn (fragmentation proportion within each window). (a) 1986, (b) 1991, (c) 1996, (d) 2000, (e) 2005, and (f) 2010.
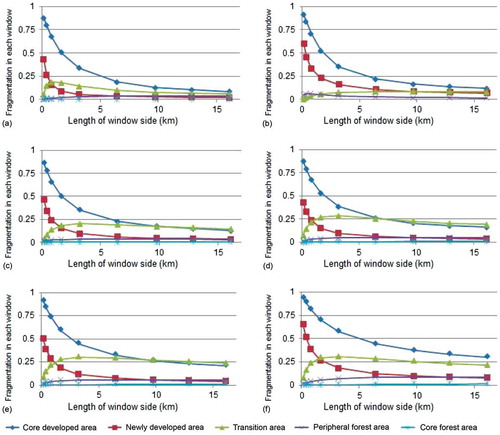
Figure 8. The results of the ISO clustering analysis around Rio Branco, Capital of Acre, Brazil, from 1986 to 2010, using the migrating means clustering algorithm (also known as the ISO cluster) which is based on the similarity of Pn (fragmentation proportion) within 9 window sizes. (a) 1986, (b) 1991, (c) 1996, (d) 2000, (e) 2005, and (f) 2010.
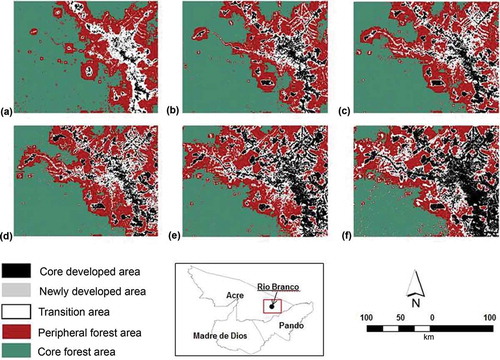
Table 3. Summary of forest/non-forest areas from 1986 to 2010 around Rio Branco, Acre*.
Table 4. Summary of ISO cluster analysis in percentage from 1986 to 2010 around Rio Branco, Acre*.