
Figures & data
Figure 1. Location of the study area within the former city of Hanoi.
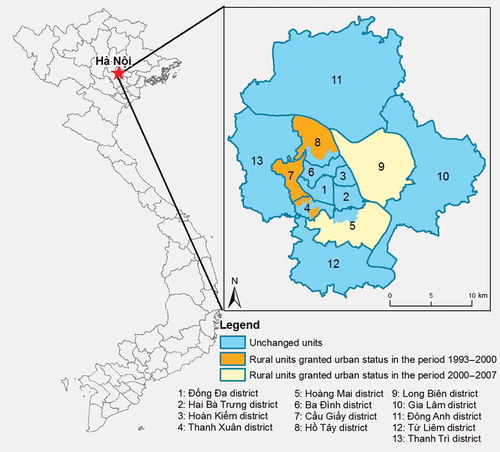
Table 1. Population of the study area in 1993, 2000 and 2007.
Table 2. Classification rules.
Table 3. Description of the spatial metrics used in this study (McGarigal et al., Citation2002).
Table 4. Confusion matrix conducted for the 2007 image classification (unit = ha).
Figure 2. Final classification of land cover types in 1993, 2000 and 2007.
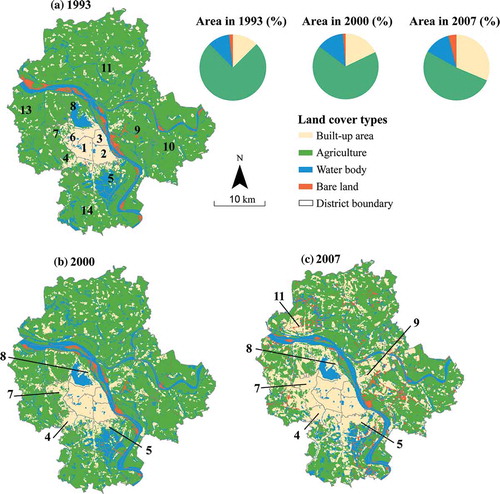
Table 5. Trajectories of land cover change in 1993–2000 (above) and in 2000–2007 (below) (unit = ha).
Table 6. Extent and annual change and annual rate of change of land cover types.
Figure 3. Changes in the five metrics over the two periods of observation.
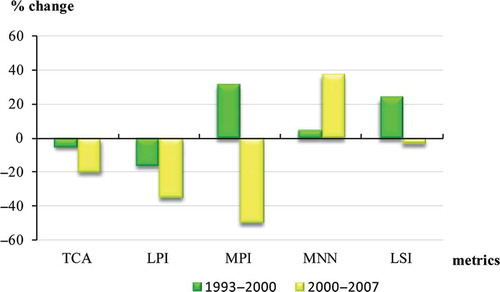
Figure 4. The process of agricultural landscape transformation: agricultural patches in the peri-urban are fragmented in 1993 and become more irregular (2000) then isolated from each other (2007).
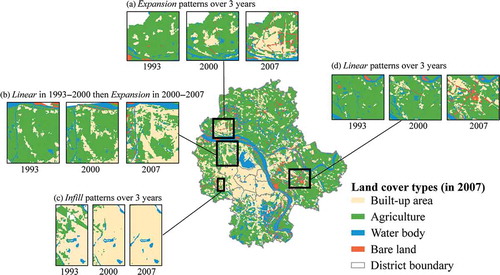
Table 7. Mean values of changes in area and metrics for each administrative group.