Figures & data
Figure 1. Four examples of man-made drainage features in the Hérault département in the south of France. (A) a small ditch conveying runoff at the bottom of a terrace front on a hilly landscape, (B) a ditch in a flat area, (C) a roadside ditch and (D) a sunken path that also acts as a drainage ditch.
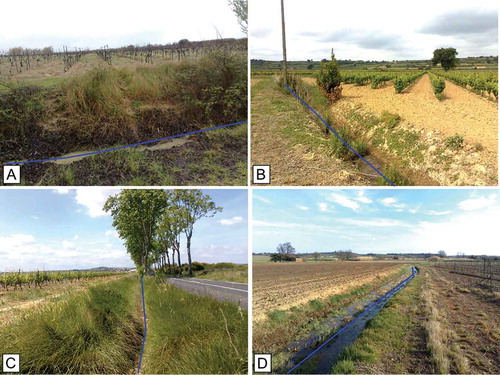
Figure 2. Study area: the survey areas (number 1–10) are distributed throughout the vineyards (A) of the Hérault département and the three main cultivated pedo-landscapes (B).
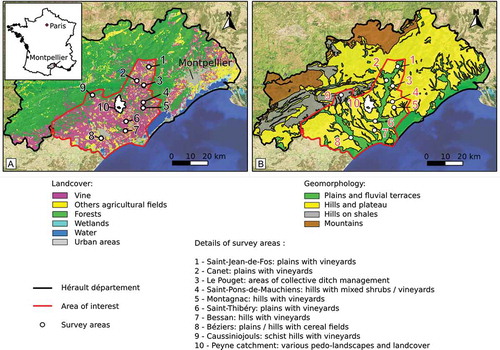
Table 1. Survey areas characteristics.
Table 2. Description of the selected explanatory variables and their assumed effect on the man-made drainage density.
Table 3. Available spatial data.
Figure 3. Selection of the grid cell size. Left: dip statistics of the unimodality test as a function of the grid cell size. Right: coefficient of variation of drainage density as a function of the grid cell size.
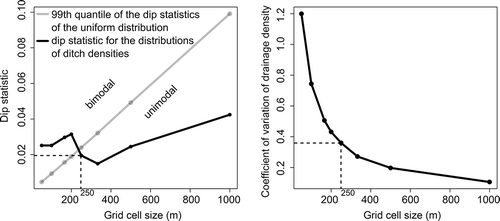
Figure 4. Example of the computation of the drainage density of six contrasted grid cells in the Peyne subcatchment at a resolution of 250 250 m.
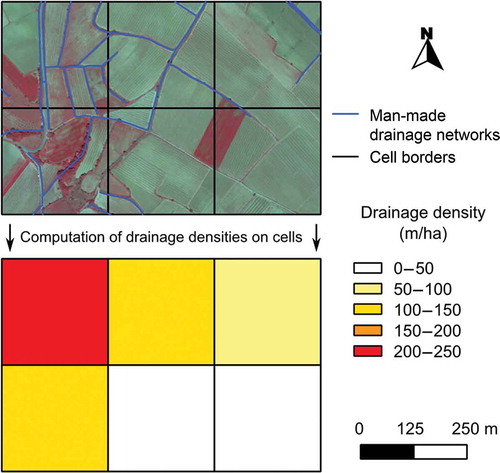
Figure 5. Distributions of drainage density by survey area. All of the plots represent 16 grid cells of 250 250 m, except for the Peyne subcatchment (519 grid cells). The line within the box represents the median, while the boxes represent the interquartile range, and the whiskers extend to the most extreme data point which is no more than 1.5 times the interquartile range from the box.
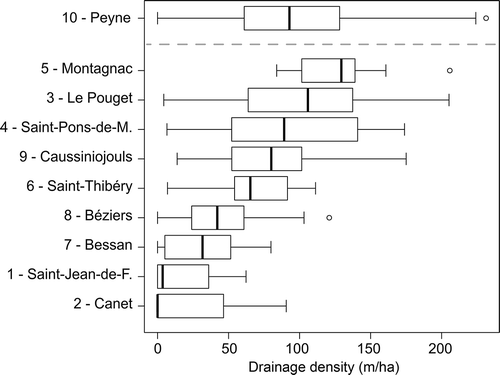
Figure 6. Model quality. Left: coefficient of determination. Right: root mean squared error. The line within the box represents the median, while the boxes represent the interquartile range, and the whiskers extend to the most extreme data point which is no more than 1.5 times the interquartile range from the box.
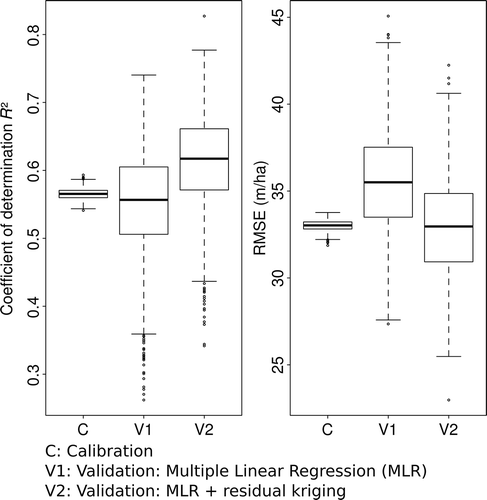
Figure 7. Maps of man-made drainage networks and of the actual and the modeled man-made drainage densities for the Peyne subcatchment.
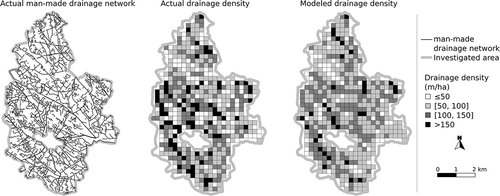
Table 4. Results of the multiple linear regression.
Table 5. Results of the partial multiple linear regression models.
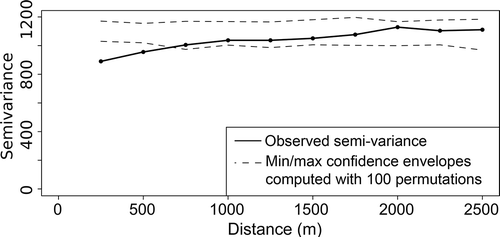
Figure 8. Semivariogram of the residuals of the multiple linear regression model for the entire sample.