Figures & data
Figure 1. South-eastern region of Zimbabwe.
Figure 2. Land cover types (a) earlier (1995), (b) before (2000), (c) after (2005) and (d) long after (2011) the FTLR of 2000 in the south-eastern part of Zimbabwe.
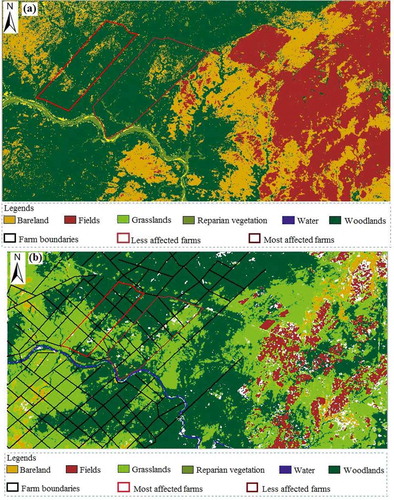
Figure 2. (Continued).
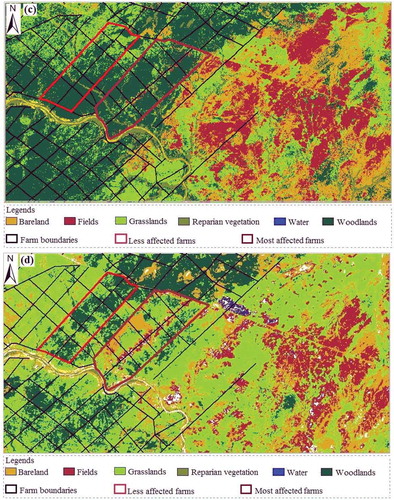
Figure 3. Spatial distribution of different land cover types in farms that were least affected by the change in land tenure. Above (a) represents the least affected farms in 2000 while (b) represents least affected farms after the FTLR in 2011.
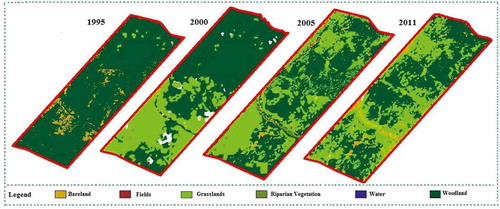
Figure 4. Spatial distribution of different land cover types in farms that were most affected by the change in land tenure from 1995 to 2011.
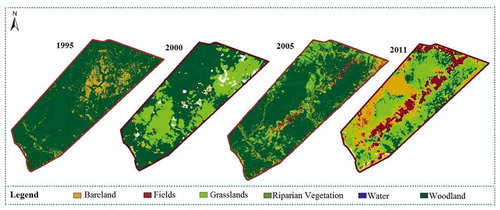
Figure 5. Significant differences (p < 0.05) amongst and within the areas occupied by the six land cover types across the study area before (2000) and long after (2011) the FTLR based on the MacNemar’s test. Error bars denote confidence intervals at 95% (Cumming & Finch, Citation2005; Masocha, Citation2010; Payton et al., Citation2003).
Figure 6. Significant differences (p < 0.05) amongst and within the areas occupied by the six land cover types before (2000) and long after (2011) the FTLR based on the MacNemar’s test. Error bars denote confidence intervals at 95% (Cumming & Finch, Citation2005; Masocha, Citation2010; Payton et al., Citation2003), (a) shows changes in areas that were least affected and (b) those that were most affected by tenure change.
Figure 7. Change in the area occupied by each land cover type in the south-eastern region of Zimbabwe in areas that were (a) least affected as well as most areas before and after the land tenure change, (b) percentage changes per land cover change after the land tenure change between 1995 to 2000, 2000 to 2005 and 2005 to 2011, (c) the differences in between the areal extent induced by natural and anthropogenic activities in between (i) 1995 to 2000, (ii) 2000 to 2005 and (iii) 2005 to 2011.
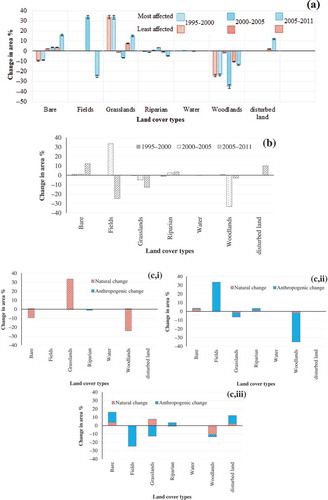
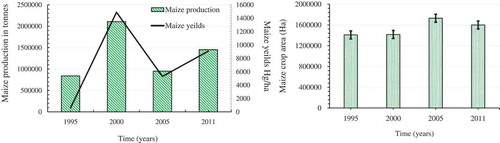
Figure 8. Variations in maize production yield and crop area between the period of 1995 to 2011 before (1995). The data was derived from the website of FAOSTA (http://faostat3.fao.org/download/Q/QC/E).