Figures & data
Figure 1. Map of the study region, showing the distribution of the South American Dry Chaco. Mean annual rainfall (in mm, grey shaded area) and mean annual potential evapotranspiration (in mm, PET, white isolines) are shown. Climatic data (1959–2002) were obtained from a 30-minute meteorological database (CRU-UEA, New, Lister, Hulme, & Makin, 2002).
Table 1. Confusion matrix for land-use classifications showing user’s and producer’s accuracies. Results of supervised classifications for 2012 and 2001 (within parentheses) are shown.
Figure 2. Land-use classifications for years 2001 and 2012 in the Dry Chaco. The areas classified as crops and pastures during 2001 and 2012, as well as the areas that changed from pastures (2001) to crops (2012), are indicated. Areas changing from croplands (2001) to pastures (2012) were not observed. The areas not considered in the analysis corresponded to water bodies, frequently flooded areas and high-slope terrains.
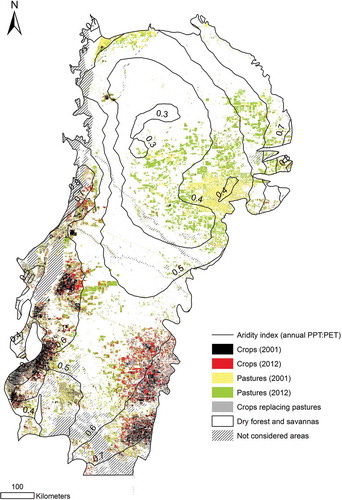
Figure 3. Relationship between land use and aridity index in the Dry Chaco. (a) Current distribution (i.e. 2012 classification) of crops, pastures and dry forests/savannahs across the aridity gradient. (b) Changes in pasture and crop areas between 2001 and 2012 across the aridity gradient (percentage of the area changed for each land use; 3.5 Mha in croplands and 5.1 Mha in pastures). (c) Box plot of aridity level distribution of grid cells occupied by crops and pastures in 2001 and the new crop and pasture areas developed between 2001 and 2012. The boxes represent first and third quartiles, and the whiskers show 5–95% intervals of results. The thick black line represents the median and the square represents the mean value.
Figure 4. Relationships between the aridity index (PPT:PET) and the crop water stress index (CWSI) in the Dry Chaco. (a) Mean CWSI (black triangles) and 80th (grey circles) percentile of CWSI, for the 43 years modelled (1959–2002), across the aridity gradient. Only grid cells where deforestation was higher than 20% were considered in this analysis. The CWSI for each grid cell was simulated considering a late summer cropping strategy. (b) Drought frequency across the aridity gradient. The mean drought frequency (for each aridity level) was estimated as the numbers of years for each grid cell with mean CWSI higher than 0.30 in relation to the total number of years modelled.