Figures & data
Figure 1. Conceptual diagram showing how the context and contributing factors connects the stability of food availability, access, and utilization to food security outcomes. Red parameters can be seen using remote sensing information. Derived from IPC (Citation2012).
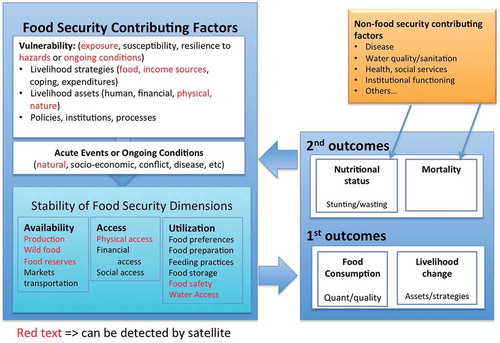
Table 1. Food security components and the remote sensing observations that can be used to derive them.
Figure 2. Maize production, cropped area in hectares, and yield in hectograms/hectare in Zambia, UN Food and Agriculture country statistics from the FAO statistics database (FAO, Citation2016b).
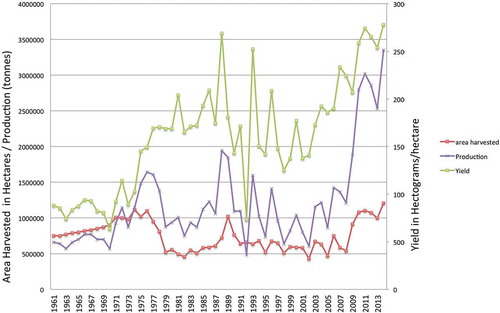
Figure 3. Map of FAO per capita food production by country for 2013 (FAO, Citation2016b). Countries with economies that are dependent on agriculture often have labor-intensive agricultural systems characterized by smallholders, which results in much lower production per person than capital-intensive systems.
Figure 4. Regional aggregated crop yield per hectare from 1961 to 2013 from the FAO statistics database (FAO, Citation2016b).
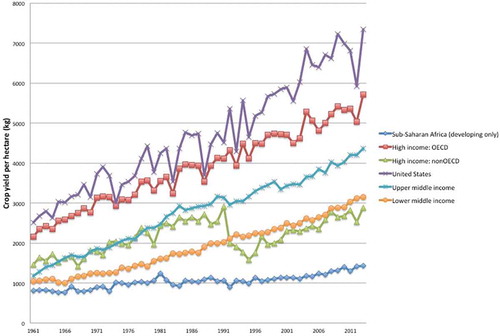
Figure 5. Rainfall anomalies from the two most populous regions in Ethiopia using the Climate Hazards Infrared Precipitation with Stations (CHIRPS) rainfall data and Ethiopia annual expenditure data growth per year (%) from the United Nations statistics division.
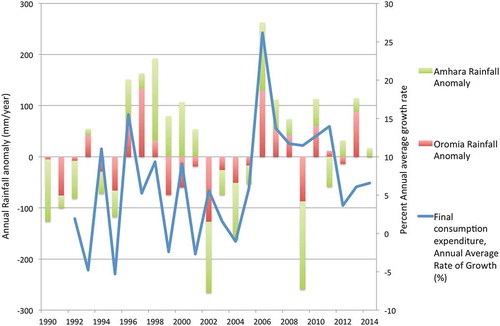
Figure 6. Food and commodity price indices for wheat, maize, crude petroleum, and food from the United Nations statistics service and Food and Agriculture Organization (FAO).
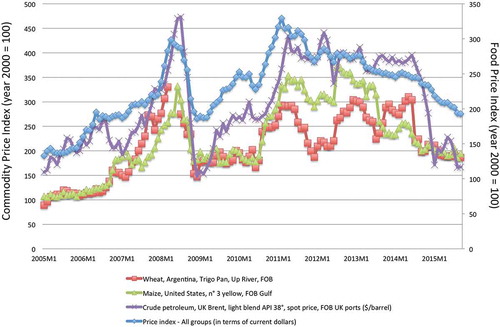
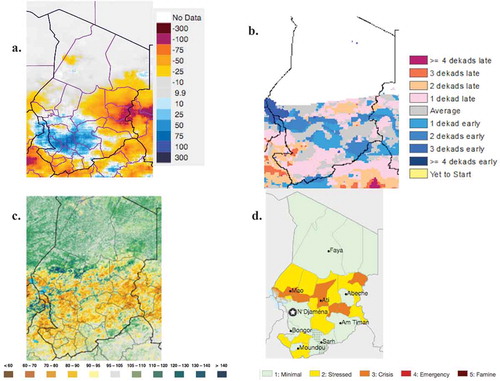
Figure 7. Food security in Chad, 2015–2016. A. CHIRPS standardized rainfall anomaly, June 1–July 31, 2015. B. MODIS NDVI percent anomaly for July 16–25, 2015. C. Start of season anomaly for 2015 growing season, number of 10-day periods (dekads) later than normal. D. Integrated Acute Food Security Phase Classification (IPC) for Chad for the period of February to May 2016 from the Famine Early Warning Systems Network (IPC, Citation2012).