Figures & data
Table 1. Population of selected cities, ordered by 2010 population size.
Table 2. Landsat path/rows, years of acquisition, number of scenes and sensors used in the acquisition.
Figure 1. Selected cities in West Africa.
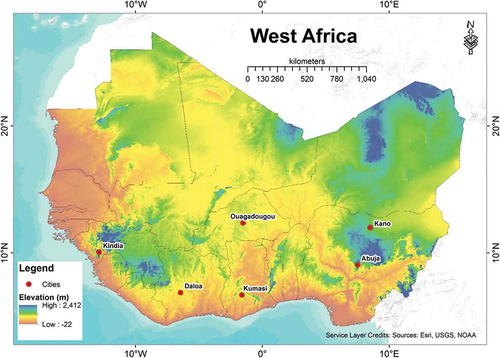
Figure 2. Flow chart of mapping and analyzing urban growth in West Africa.
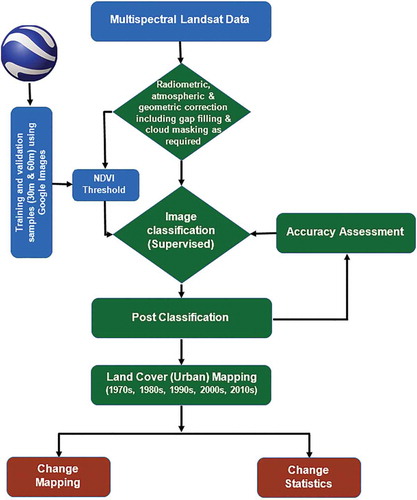
Table 3. Land use/land cover class (LULC) and number of pixels from Google Earth™ images retained for training and validation.
Table 4. NDVI threshold used for refining ground truth pixels collected using Google Earth.
Table 5. Accuracy assessments of classified images and total built-up area.
Figure 3. Two data points (30 m × 30 m) collected using Google Earth. The pixel on the left panel shows a mix of land cover classes, cropland (70%) and grass and herbaceous near Abuja, Nigeria. The pixel on the right panel shows a mixed pixel with buildings (80%) and unpaved roads (20%) near Kano, Nigeria.
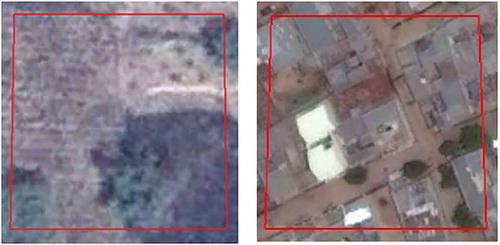
Figure 4. Urban built-up area of the city of Daloa, Cote d’Ivoire.
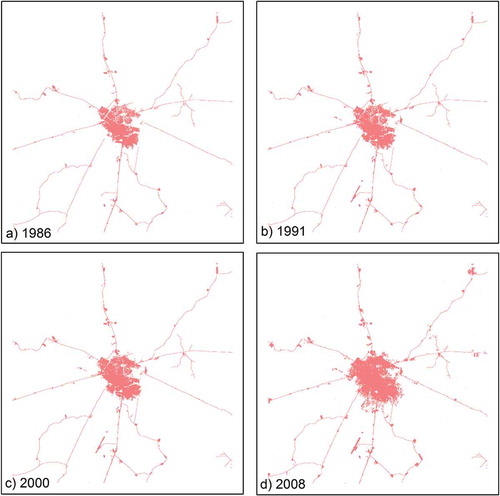
Figure 5. Urban built-up area of the city of Kindia, Guinea.
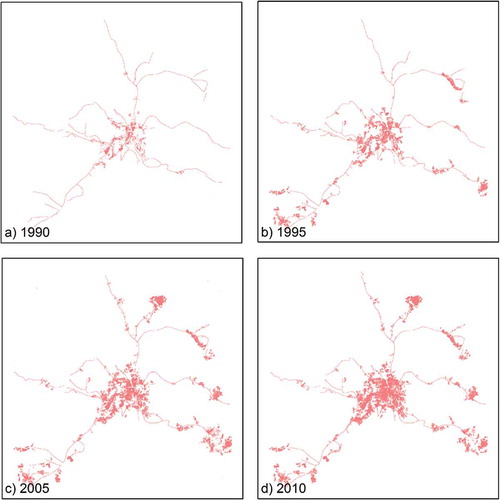
Figure 6. Urban built-up area of the city of Ouagadougou, Burkina Faso.
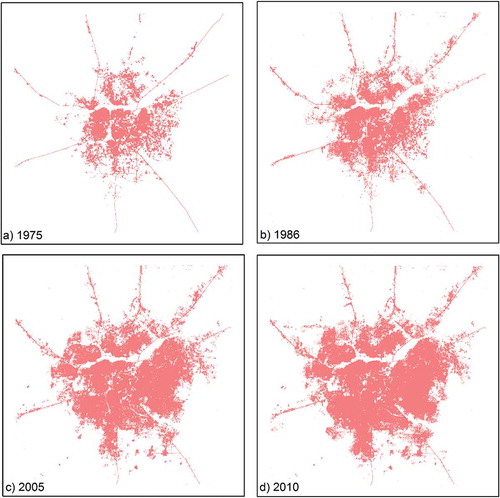
Figure 7. Urban built-up area of the city of Kumasi, Ghana.
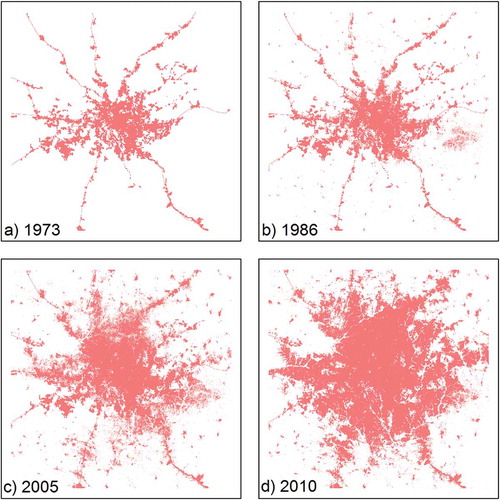
Figure 8. Urban built-up area of the city of Abuja, Nigeria.
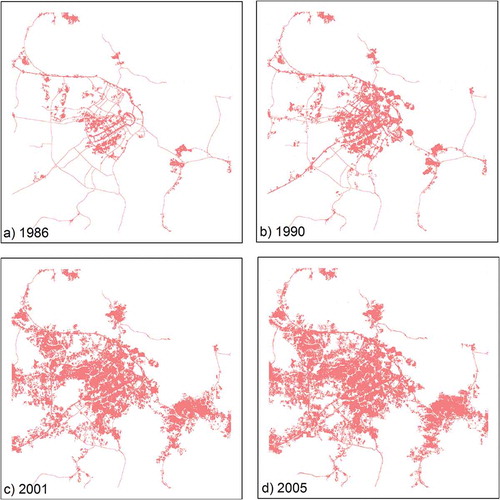
Figure 9. Urban built-up area of the city of Kano, Nigeria.
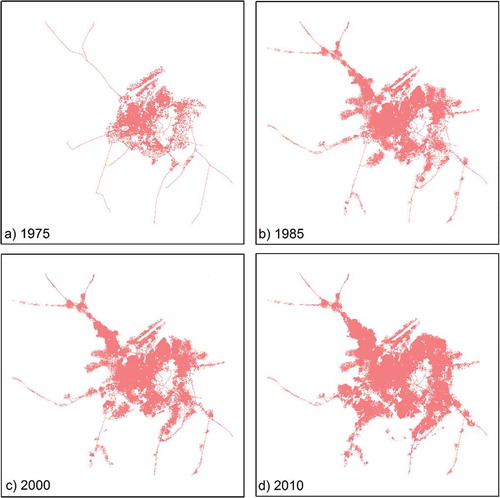
Figure 10. Urban area over the years since 1970 for (a) Daloa and Kindia, (b) Ougadougou and Kumasi, and (c) Abuja and Kano.
Figure 11. Temporal scaling of the growth in urban area and population.