
Figures & data
Figure 1. Pays de Brest – Urban amenities and daily-commodities service areas.
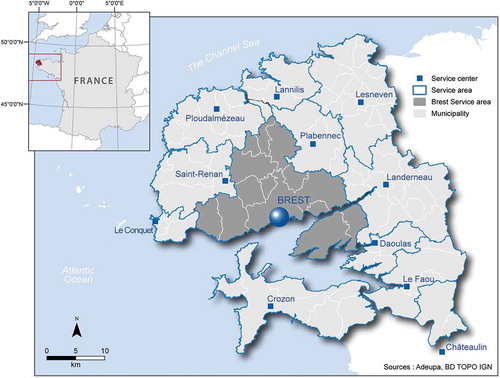
Figure 2. Yearly build rates in Pays de Brest between 1968 and 2009 (new houses/100,000 suitable plots).
Figure 3. Evolution of plots at 0–100 m from the sea shore according to the type of planning bylaw in the municipality.The area of selected plots ranges from 200 to 2000 m2. Smaller and larger plots are excluded from the analysis. Bylaws: UDP: urban development plan; LUP: land-use plan; LUS: local urbanism schema. None: no bylaw; built: plots used for housing; protected: unavailable plots (e.g. owned by the Conservatoire du littoral, nature reserve).
Figure 4. Kaplan–Meier survivor function of building land in Pays de Brest from 1968 to 2009 by distance to the sea shore (plots between 200 and 2000 m2).
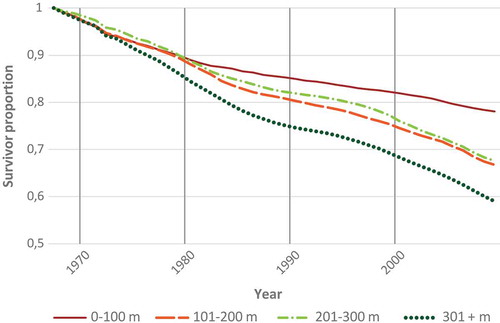
Figure 5. Kaplan–Meier survivor function of building land in municipalities with LUP or LUS from 1979 to 2009 by distance to the sea shore (plots between 200 and 2000 m2).
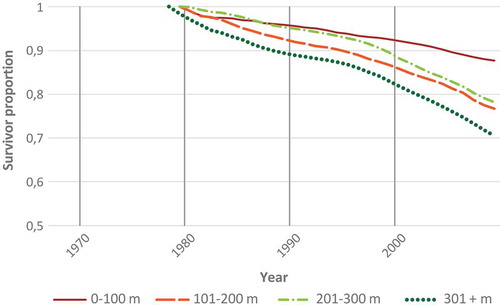
Figure 6. Kaplan–Meier survivor function of building land in coastal municipalities with LUP or LUS from 1986 to 2009 by distance to the sea shore (plots between 200 and 2000 m2).
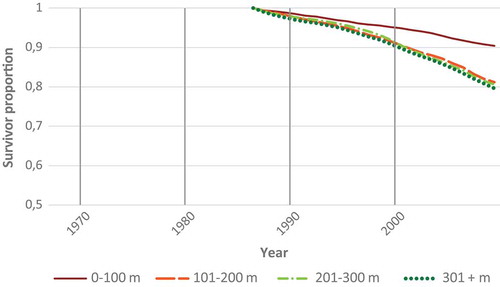
Table 1. Cox proportional hazard models of the impact of the Coastal Law and bylaws on the protection of the sea shore.
Table 2. Impact of the time-varying covariates and parameters between 1968 and 2009 – Equation 7.
Table 3. Wald tests of equality between hazard ratios of distance strips to the sea shore in the time-varying covariate model.
Table 4. Wald tests of equality between hazard ratios of treatments at less than 100 m from the sea shore.
Appendix 2. Adjustment of Cox proportional hazard models.