Figures & data
Figure 1. Northern glaciated plains ecoregion, with starting 2012 land cover from the cropland data layer. The region covers over 140,000 km2 and 956,983 individual ownership/management units.
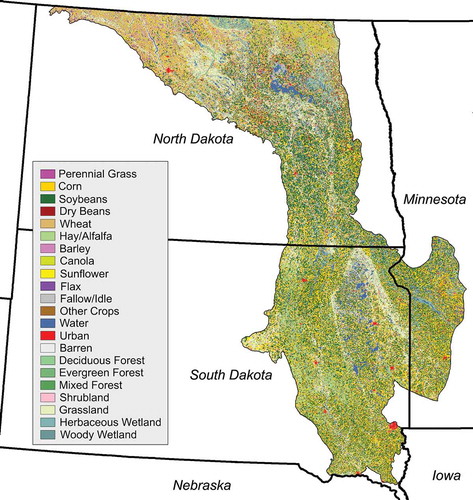
Figure 2. Starting LULC proportions for 2012, and the targeted proportions for 2030 based on the Billion Ton Update scenario.
Figure 3. The crop type (from CDL) that composed the majority of a given field (from CLU) was assigned to all agricultural pixels within that field. Water, wetland, and urban pixels within a given field were maintained.
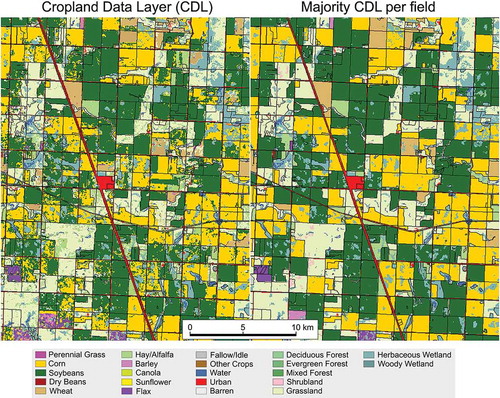
Table 1. Ancillary data sets used in the construction of suitability surfaces for the spatial allocation component of FORE-SCE.
Figure 4. A final model run for a portion of the ecoregion in central North Dakota. The five panels represent starting land cover in 2012 (both 30-m (A) and 250-m (B) resolution), the new parcel-based, 30-m resolution model for 2030 (C), the old, pixel-based, 30-m resolution model for 2030 (D), and the old, pixel-based, 250-m resolution model for 2030 (E).
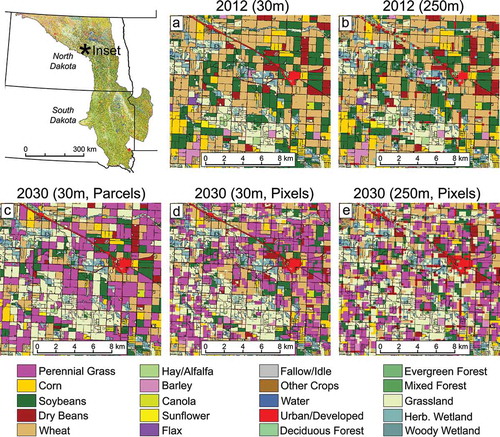
Figure 5. Aggregated probability-of-occurrence for the year 2030 across 50 Monte Carlo runs for (1) cropland (aggregate of all cultivated crop classes), (2) natural grassland, (3) perennial grass (biofuel feedstock under the BTU scenario), and (4) urban lands.
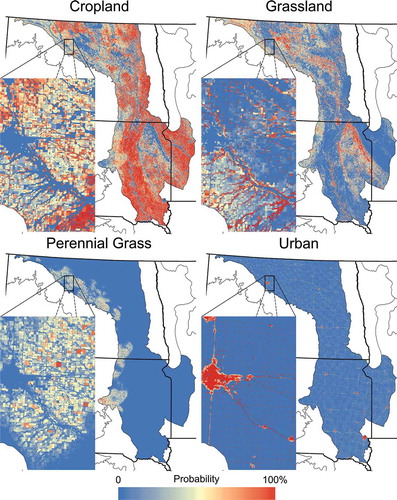
Figure 6. Modeled results compared to BTU scenario demand for 2030. Model means for each LULC class are shown, along with minimum and maximum area modeled across the 50 Monte Carlo runs.
Figure 7. County-level comparison between modeled and BTU data, depicting quantity of six major cropland classes. For counties that intersect the border of the modeled ecoregion, BTU crop areas were adjusted proportionally according to the area of the county within the ecoregion boundary.
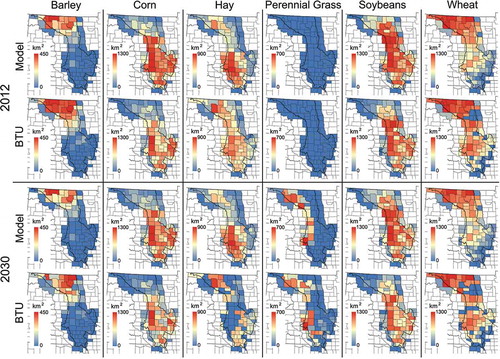
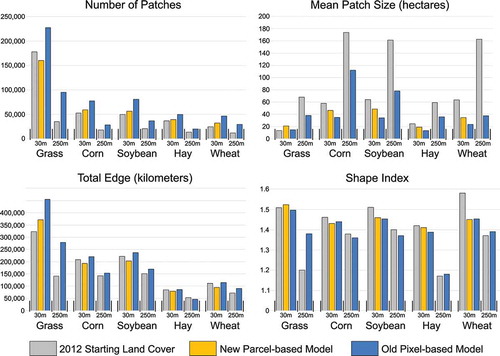
Figure 8. Landscape metrics for the five most common land cover classes for (1) the starting 2012 land cover at both 30- and 250-m resolutions and (2) the modeled 2030 land cover from the new 30-m parcel-based model, and from the old pixel-based model at both 30- and 250-m resolution.