Figures & data
Table 1. Characteristics of the forest stands, including volumes and carbon content of the forest before and after harvest, productive machine hours (as a sum of harvester and forwarder) and emissions of CO2, CH4 and N2O from harvest operations. Retention category refers to the % of trees left in the stand after harvest. Volumes refer to stem under bark. Total C include carbon stocks in vegetation (below and above ground) and soil.
Figure 1. Radiative forcing following forest harvest across different tree retention levels. Results include contributions to radiative forcing from carbon fluxes and albedo dynamics and aggregate the outcomes of the individual 12 forest stands of the experiment into retention category very low (a), low (b), medium (mid) (c) and high (d). For each forest stand, three buffer zone simulations are considered for modelling post-harvest dynamics, representative of tree growth competition with radius equal to 0 m (Buffer 0), 4 m (Buffer 1), and 6 m (Buffer 2). The average of these simulations in the same retention category are shown with solid lines, and the coloured areas indicate the minimum and maximum values.
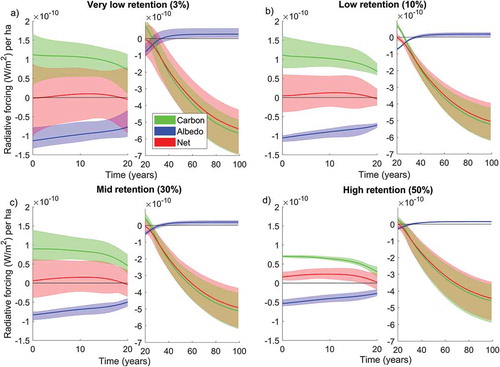
Figure 2. Net radiative forcing results after combinations of contributions from CO2 fluxes and surface albedo changes. (a) comparison of net impacts for the average results in the four retention categories; (b) comparison of net radiative forcing in relative terms, using the results of the very low retention category as a benchmark.
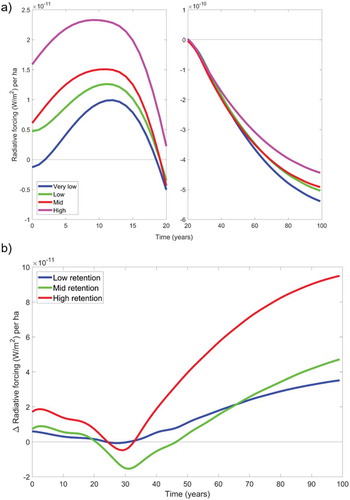
Figure 3. Relationships between radiative forcing per hectare at 10 (a) and 100 years (b) after harvest and key characteristics of the forest stands, such as number of trees retained and fraction of m3 retained. Results (Buffer 1 only) show the net effects and the single contributions from carbon and albedo.
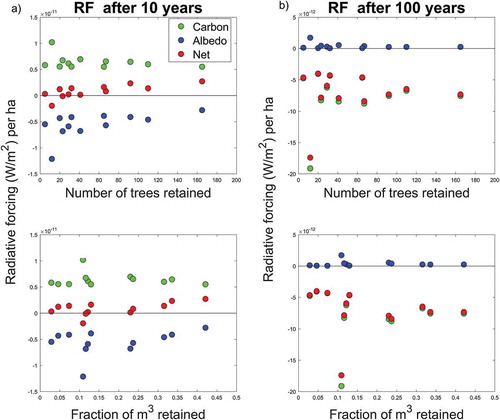
Figure 4. Radiative forcing per ha normalized to the unit of wood harvested (expressed as tons of carbon, tC) 10 years after harvest (Buffer 1 only). (a) normalized contributions from carbon and albedo and net results for the individual forest stands; (b) normalized net radiative forcing as a function of number of trees retained.
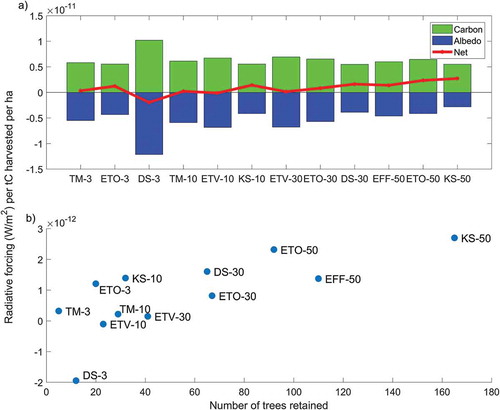
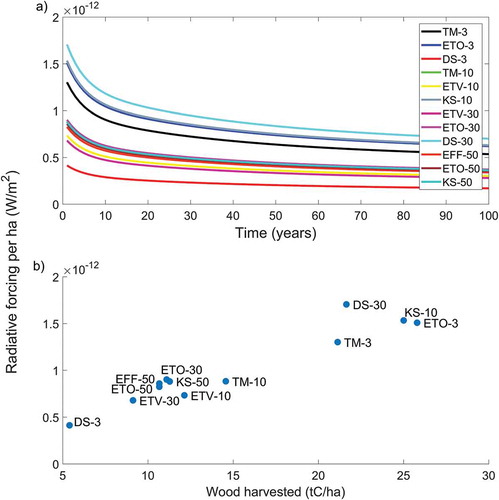
Figure 5. Radiative forcing impacts for each of the individual forest stands of GHG emissions from harvest operations (a) and as a function of the corresponding amount of wood harvested (b).