
Figures & data
Figure 1. Location map of La Vía Láctea territory, Matagalpa, Nicaragua.
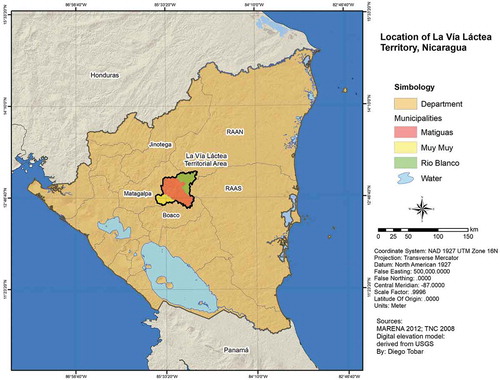
Figure 2. Data processing flowchart.
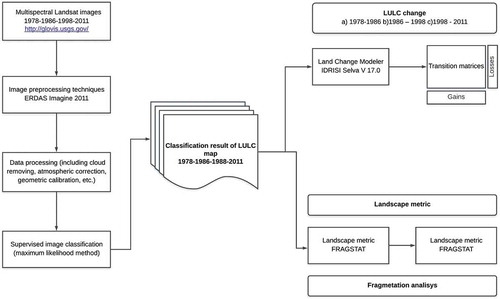
Table 1. Description of land use and land cover classes types and bands combination.
Table 2. Landscape metrics used for fragmentation analysis, selected from Fragstats (McGarial & Marks, Citation1995).
Figure 3. Land cover change (forest cover and agricultural cover) for the period 1978–2011, in La Vía Láctea territory, Nicaragua.
Figure 4. Dynamics of LULC change by year in La Vía Láctea territory, Matagalpa, Nicaragua (1978–2011), resulting from the interpretation of Landsat satellite images.
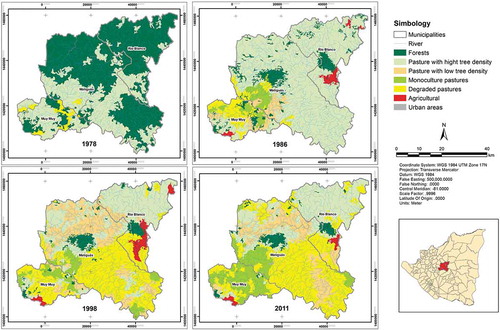
Table 3. Changes in land-use between 1978 and 2011 in La Vía Láctea territory, Matagalpa, Nicaragua. Area in hectares per use/year.
Table 4. Changes transition matrices in La Vía Láctea territory from A) 1978–1986, B) 1986–1998, C) 1998–2011 showing the area (hectares) of land-use change between categories: (FO) Forests, (PHD) Pastures with high tree density, (PLD) Pastures with low tree density, (MP) Monoculture pasture, (DP) Degraded pastures, (AA) Agricultural areas, (UA) Urban areas, (cr) Change rate. The bolded figure is the sum of diagonals and represents the overall persistence (i.e., the landscape that did not change).
Figure 5. Magnitude (%) of land-use gains and losses for each LULC in La Vía Láctea territory, Matagalpa, Nicaragua (a) 1978–1986, b) 1986–1998 and c) 1998–2011.
Table 5. Calculated landscape metrics from LULC classifications in La Vía Láctea territory (Matagalpa, Nicaragua) for 1978–2011. Number of patches (NP), Average patch size (MN), Index of the weighted average of the form by area (AWMSI), Index of the form average (MSI), Edge Density (ED), Shannon Equity Index (SHEI), Euclidean Mean Distance Nearest Neighbor (ENN).