Figures & data
Figure 1. Geographical model for agricultural landscape change
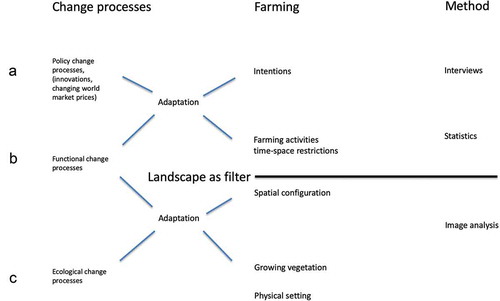
Figure 2. Location of study area
To the left is the location of the map shown to the right in central Sweden. To the right the study area is shown by the square.
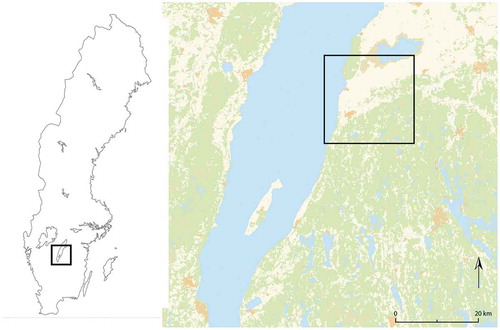
Figure 3. Shows the principal of the contextual segmentation method, adopted from Nielsen (Citation2014)
Figure 4. Land configuration images 1977 and 2008
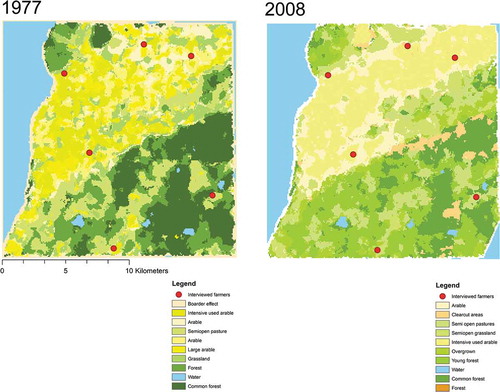
Figure 5. Number of mixed farms in study between 1995 and 2007
Source: Statistics of Sweden
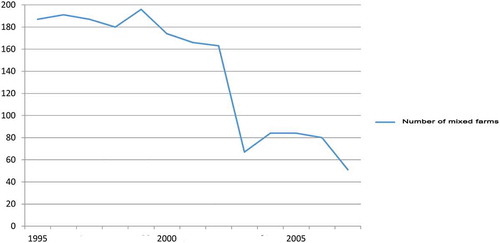
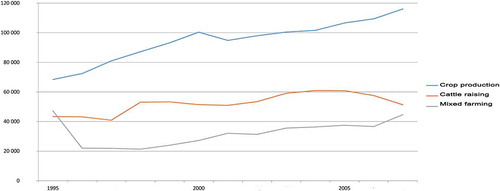
Figure 6. Incomes (swedish krona) from different forms of farming in study area 1995–2007
Source: Statistics of Sweden