
Figures & data
Figure 1. Study area
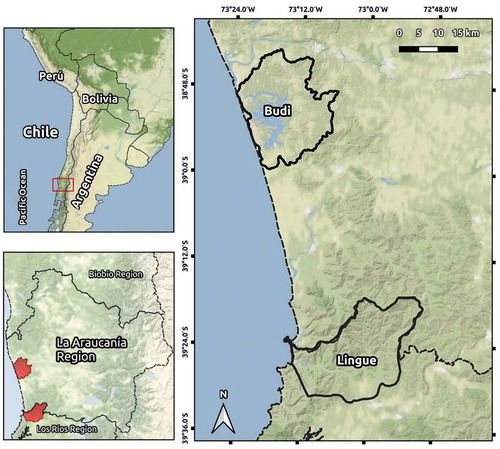
Table 1. Description and source of chosen location factors related to tree plantation expansion
Figure 2. Land use/cover change for the Budi and the Lingue basins between 1987 and 2015
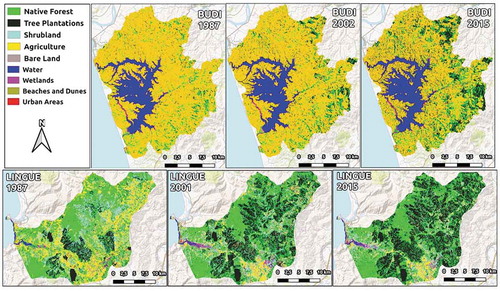
Figure 3. Twenty-eight years of tree plantation expansion in the Budi and Lingue basins. (A) Budi 1987–2002, (B) Budi 2002–2015, (C) Lingue 1987–2001 and (D) Lingue 2001–2015
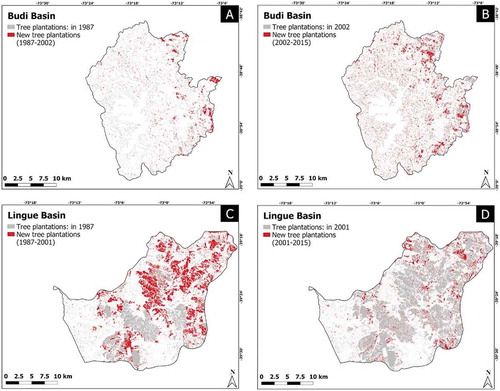
Table 2. Tree plantation expansion in the Budi and Lingue basins
Table 3. Location factors in the Budi and Lingue basins obtained from the four average logistic models. Values are given for all the location factors having values higher than 0.7 in the sum of AIC weights. Average logistic regression coefficient (β) and odds ratio (OR) are shown for each location factor. OR for continuous location factors were calculated using the following thresholds: Property size every 10 ha; distance to urban every 10 km, distance to the hydrographic network every 400 m, distance to previously established tree plantations every 100 m, distance to road network every 100 m, altitude every 100 m (more details in supplementary material)