Figures & data
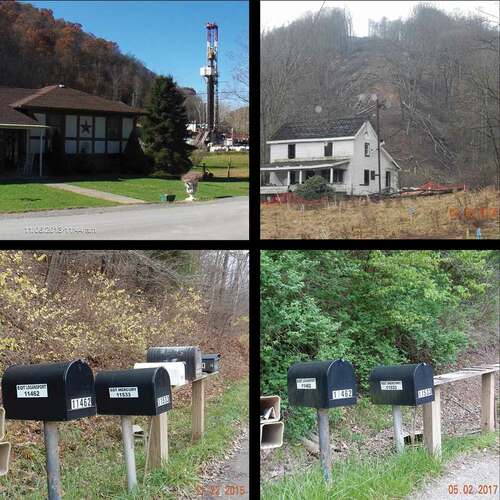
Figure 1. Mobley, location respective to Appalachia and the US
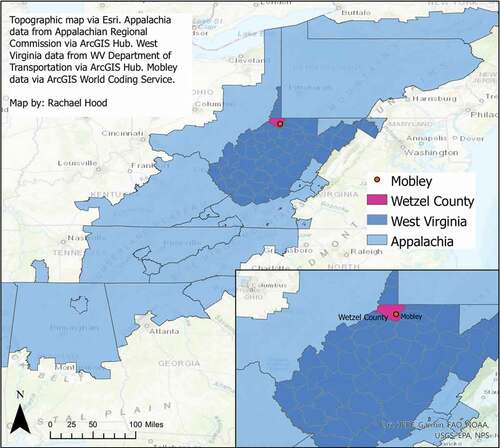
Figure 2. This satellite imagery reflects the industrial development in Mobley over a seven-year period. The top left image was captured 7 June 2009; top right 9 July 2011; bottom left 5 September 2013; and bottom right, 5 October 2016. Images taken from Google Earth and provided by USDA Farm Service Agency
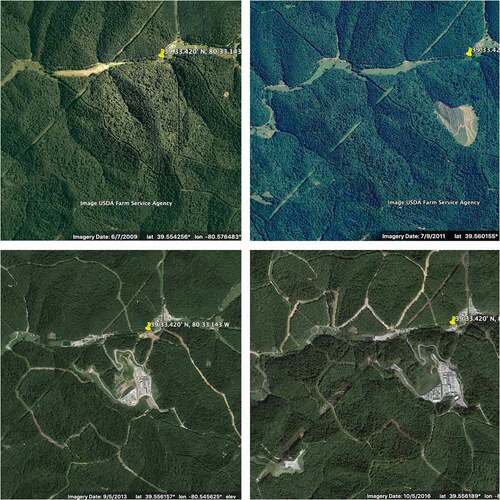
Figure 3. Mark West Plant between 2012 and 2017. Photos by Bill Hughes (15 November 2012) and Vivian Stockman (10 May 2017), ohvec.org. Flyover courtesy SouthWings.org
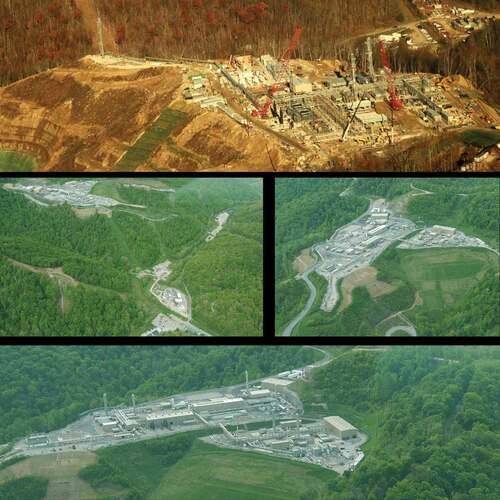
Figure 4. Construction crews, drilling permits, Mark West plants and well pads in 2015. Photos by Bill Hughes
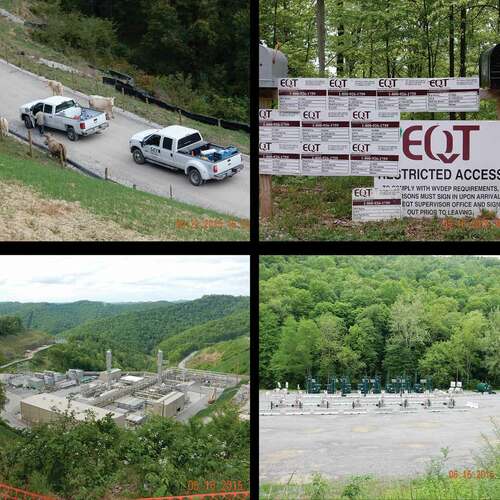
Figure 5. The top left image (11.06.13) shows a Mobley resident’s home with fracking infrastructure located only a few hundred feet away. The top right image shows an abandoned home that was purchased by Mark West, with a pipeline on the hillside behind it, as indicated by the loss of trees on the right-of-way. The bottom two images demonstrate the loss of residents through time. In the bottom-left image (11.22.15), the mailboxes on the left are EQT mailboxes, while the mailboxes on the right are for residential homes. In the bottom-right image (05.02.17), a year and a half later, only the EQT mailboxes remain