
Figures & data
Figure 1. Map of study area and crop cultivation maps based on observed land-use in 2002 and 2018, and on projections along our future land-use scenarios: historical baseline (scenario 1); climate change (scenario 2); and climate change plus adaptation measures (scenario 3).
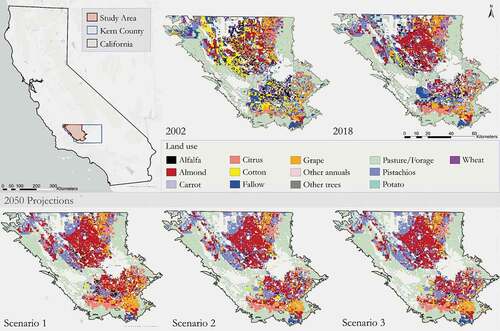
Table 1. Crop-type classification for 121 distinct crop species produced in Kern County between 2002 and 2018
Table 2. Spatial dataset description with mean value and standard deviation (in parentheses) given for all non-categorical variables
Figure 2. Illustration of modeling and landscape projection methodology.
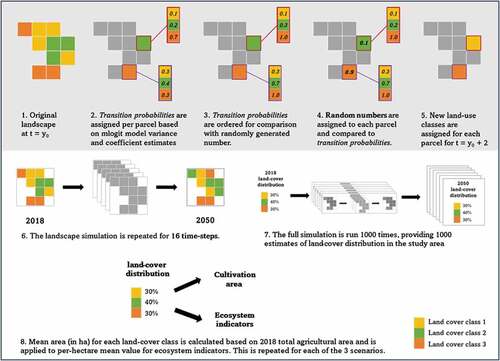
Table 3. Kern County agricultural crop area distribution. Mean and standard deviation values for observed cropland area and from 1000 future landscape projection iterations are reported in hectares, and percent change values are given in relation to observed 2018 values
Figure 3. Mean per-area estimated profits (in USD per ha) based on observed land-use in 2002 and 2018, and projected mean per-area estimated profits in 2050 along our future land-use scenarios: historical baseline (scenario 1); climate change (scenario 2); and climate change plus adaptation measures (scenario 3).
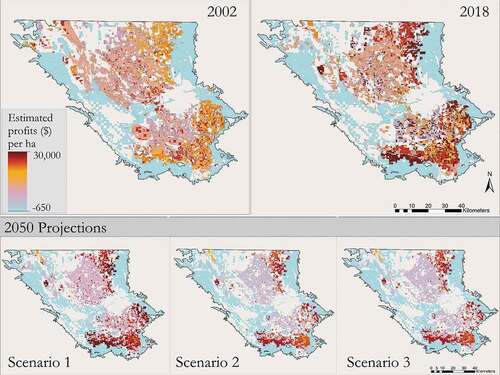
Table 4. Total ecosystem service and pressure indicator values across the study area in 2002 and 2018, and percentage increase from the 2018 baseline for 3 future land-use scenarios (in parentheses)
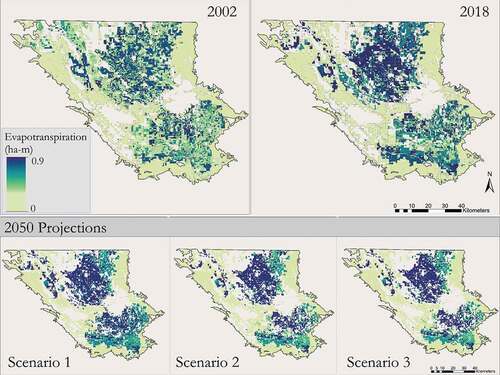
Figure 4. Mean per-area estimated evapotranspiration (in ha-m) based on observed land-use in 2002 and 2018, and projected mean per-area estimated evapotranspiration in 2050 along our future land-use scenarios: historical baseline (scenario 1); climate change (scenario 2); and climate change plus adaptation measures (scenario 3).