Figures & data
Figure 1. Case study locations. PUA Huertas: 1. Huerta de Zaragoza; 2. L’ Horta de Valencia; and 3. Huerta de Murcia-Alicante. Base map source from Sentinel-2 (L2A) data-Copernicus program, 2018 (Instituto Geográfico Nacional, Citation2018). Contains modified data Copernicus Sentinel.
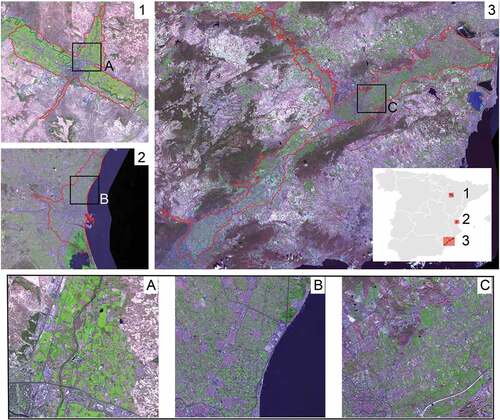
Table 1. CLC, SIOSE, and SIGPAC datasets' basic features (European Environment Agency, Citation2020b; Ministerio de Agricultura, Citation2015; urbana & Ministerio de Transportes, Citation2020). CLC, SIOSE and SIGPAC allow to publish this content.
Table 2. Comparison of artificial and agricultural areas among CLC and SIOSE by selecting the major percentage of simple coverage in each polygon.
Figure 2. Overlapped datasets from bottom to top: (1) PNOA satellite image, 2007; (2) CLC 2006; (3) SIOSE 2005; (4) SIGPAC 2005; and (5) resulting mapping with fine-grain data for addressing PUA Huertas.
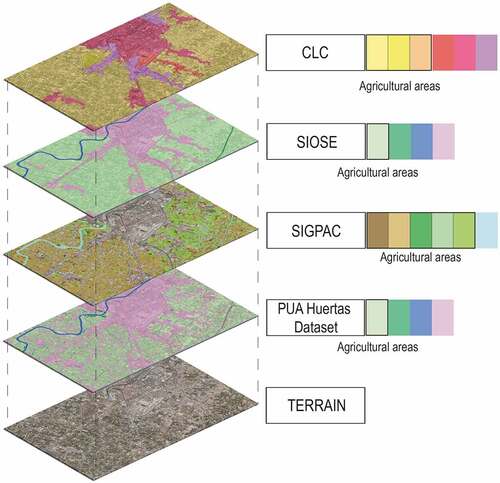
Figure 3. Conceptual workflow followed in the proposed methodology.
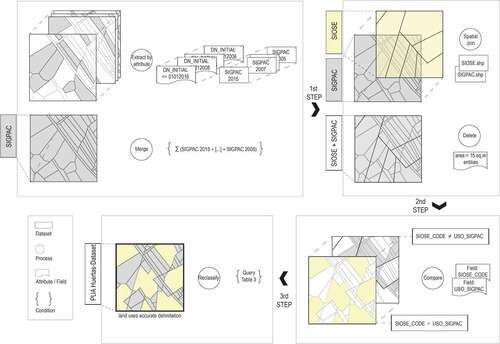
Table 3. Summary of reclassification criteria applied between SIGPAC and SIOSE land cover categories.
Figure 4. Examples of the more accurate land classification provided by the harmonized PUA Huertas dataset (below) and considering initial datasets (above): (a) new artificial and other land use areas, (b) new agricultural areas, and (c) new plasticulture crops areas.
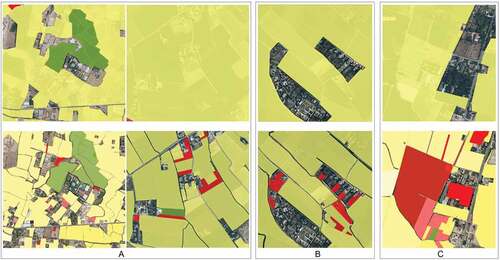
Figure 5. Comparative diagram of the areas that have been amended in the definition of PUA Huertas for the three cases considered in 2005 and 2015.
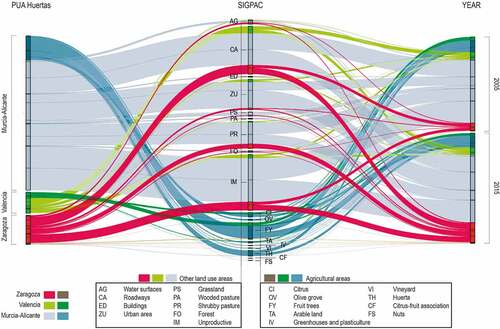
Table 4. Comparison of artificial and agricultural areas considering the proposed PUA Huertas dataset.
Figure 6. Agricultural cover changes in PUA Huertas from 2005 to 2015.