Figures & data
Table 1. Climate resilience aspects, from indicator framework, included in certification schemes studied. In addition, COCOBOD is the government body responsible for cocoa in Ghana and provides general extension to all cocoa farmers. (COCOBOD, Citation2016; IFOAM, Citation2017; Naturland, Citation2014, Citation2020; SAN, Citation2011; UTZ, Citation2015).
Figure 1. Climate resilience indicator framework for smallholder cocoa farmers as defined by farmers and value chain actors during the participatory process. Indicators are divided between the resilience components robustness, recovery and adaptability. (ag. = agricultural).
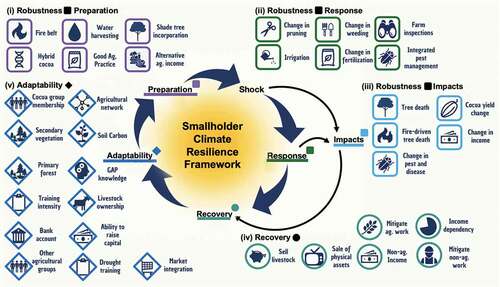
Figure 2. Map of the sampled cocoa communities. centre: country scale map of Ghana. (a): western region. (b): eastern region. symbols show location of sampled communities with the type of certification present in the community specified. Forest cover in 2000 from
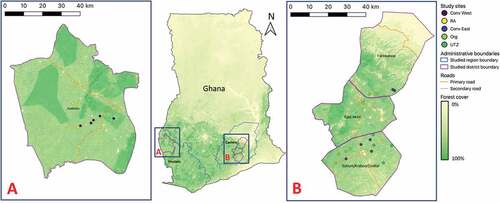
Figure 3. Effect of certification on robustness indicators (a) preparation: agricultural practices (percentage using measure) (b) preparation: climate resilient measures (percentage using measure, shade cover is % of plot area) (c) preparation: climate resilient strategies (richness is number of different shade-tree or crop species or income types (non-cocoa agricultural products)) (d) response: measures and strategies used in the face of a drought (percentage using measure). Means are presented for all indicators after matching. Significance of average treatment effect on the treated and also difference between non-certified in the two regions (*p < 0.10, **p < 0.05, ***p < 0.01).
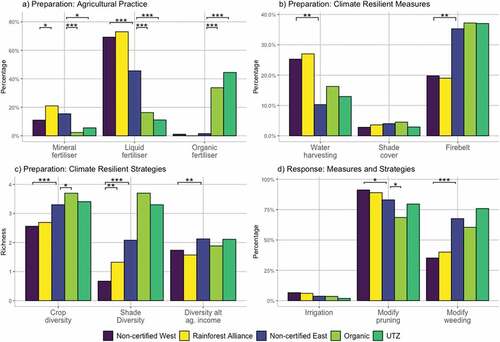
Figure 4. Impacts of 2015–2016 drought. (a) yield impacts (total of major and minor harvest) in drought season 2015–16 (dark color) and ‘normal’ season 2017–2018 (light color). yields are included from plots with cocoa trees over the age of four years at the end of the season described. Stars denote significant differences between yields within 2017–18 (after matching for certified versus non-certified) (b) percentage of farmers experiencing drought impacts as measured by tree death, fire induced tree death, and disease exasperation. Means are presented for all indicators after matching. Significance of average treatment effect on the treated (*p < 0.1, **p < 0.05, ***p < 0.01).
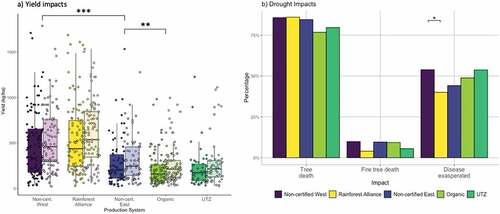
Figure 5. Effect of certification on recovery indicators: (a) redundancy strategies that reduce reliance on cocoa (proportion of cocoa income and diversity of non-agricultural income) (b) coping mechanisms to respond to the aftermath of a shock (selling of livestock or selling of agricultural items). Means are presented for all indicators after matching. Significance of average treatment effect on the treated and also difference between non-certified in the two regions (*p < 0.10, **p < 0.05, ***p < 0.01).
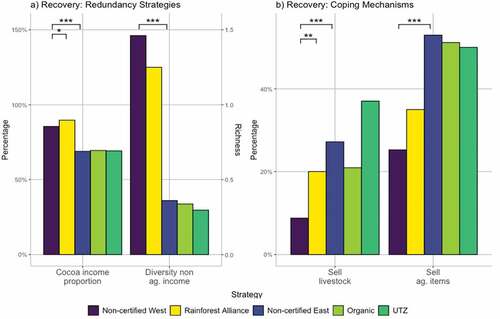
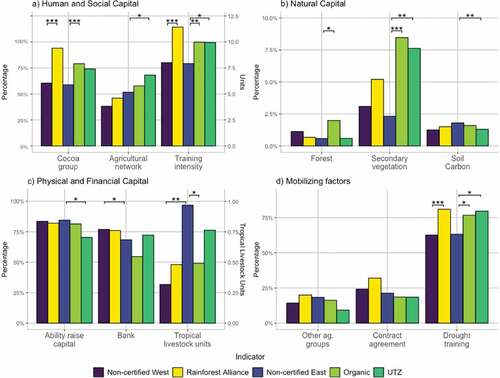
Figure 6. Effect of certification on adaptability indicators: (a) human and social capitals (percentage of farmers participating in a cocoa group, size of agricultural network (people) and number of trainings per 5-year period) (b) natural capital (percentage of forest and secondary vegetation on farm, percentage of carbon in soils) (c) physical and financial capital (percentage of farmers with ability to raise capital or access to bank accounts, tropical livestock units per household) d) Mobilizing factors (percentage of farmers with access to non-cocoa agricultural groups, with contract agreements with cocoa licensed buying companies and who received drought specific training). Means are presented for all indicators after matching. Significance of average treatment effect on the treated and also difference between non-certified in the two regions (*p < 0.10, **p < 0.05, ***p < 0.01).