
Figures & data
Figure 1. Study area.
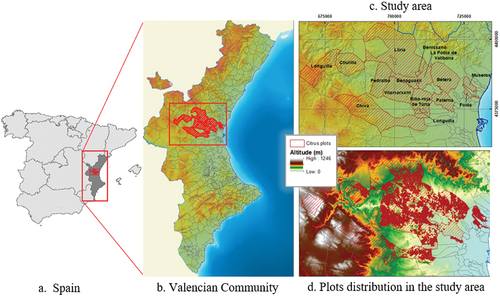
Figure 2. Methodological framework.
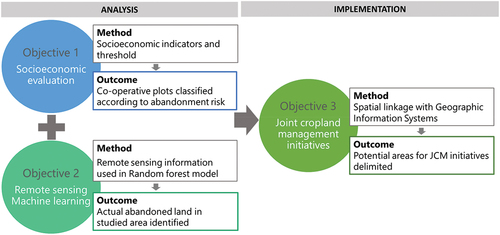
Table 1. Indicators and thresholds for the ‘traffic-light’ land use tool established by the expert panel.
Table 2. Classification of the socioeconomic characteristics of members and land plots.
Figure 3. Workflow followed to classify the plots.
Table 3. References and equations of the spectral vegetation indices evaluated in this study.
Figure 4. Categories of plots classified according to the type of land cover.Where: a) in production with large trees, b) in production with small trees, c) Not in production, d) Abandoned land.
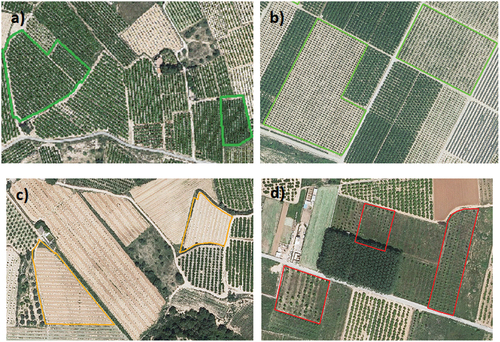
Table 4. Confusion matrix (2×2).
Table 5. ‘Traffic-light’ results for the cooperative in the case study.
Figure 5. Distribution of the plots of cooperative members according to the “traffic-light” approach.
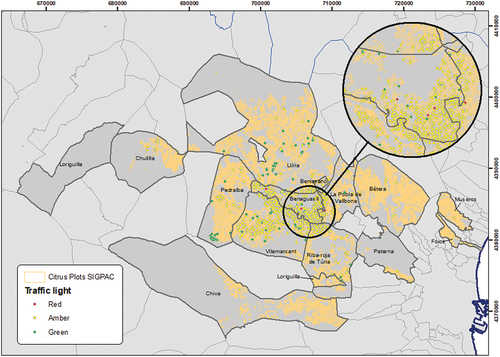
Table 6. Obtained Confusion Matrix.
Figure 6. Random Forest results.
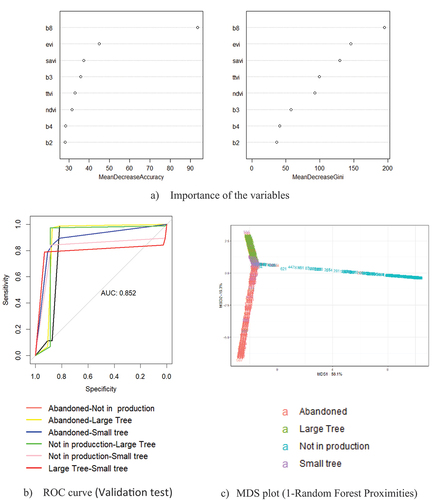
Table 7. Number of plots, surface area, and percentages of classification.
Figure 7. Map resulting from predicted model.
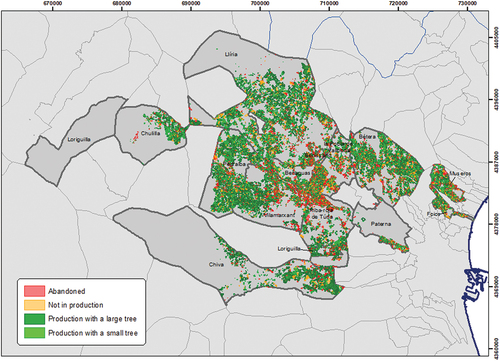
Figure 8. Potential JCM Initiatives.
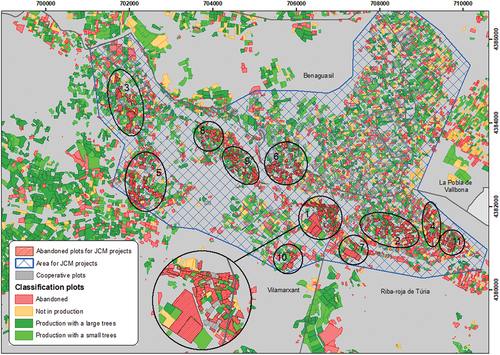
Table 8. Main productive characteristics of JCM initiatives.