Figures & data
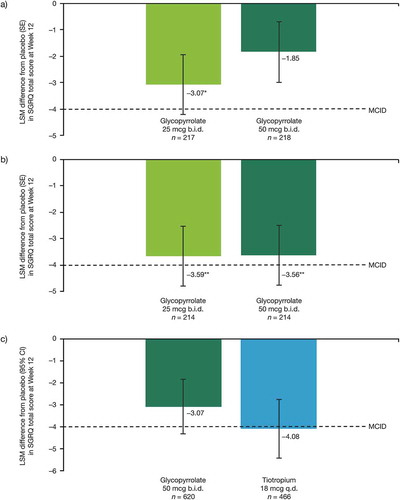
Figure 3. Placebo-adjusted, least squares mean change from baseline in SGRQ total scores in subjects receiving GLY 25 or 50 mcg b.i.d. in the GOLDEN 3 (a) and GOLDEN 4 (b) studies, and in subjects receiving GLY 50 mcg b.i.d. (57% of total population) or TIO 18 mcg q.d. (43% of total population) in the GOLDEN 5 study (c).