Figures & data
Figure 1. The relationship between FEV1 and ventilatory reserve in pediatric CF patients. Unpublished data.
Figure 2. The V̇E, VT, and BF at peak exercise in relation to age in pediatric CF patients. Unpublished data.
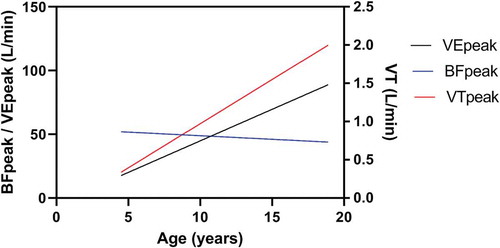
Figure 3. The V̇E/V̇CO2 ratio in adolescents with CF and healthy subjects. Figure drawn after data from [Citation44].
![Figure 3. The V̇E/V̇CO2 ratio in adolescents with CF and healthy subjects. Figure drawn after data from [Citation44].](/cms/asset/4296cf2e-ef7d-49c6-acec-91ecdd0476a5/ierx_a_1752195_f0003_oc.jpg)
Figure 4. The age-related decline in RSBI at peak exercise in adolescents with CF. Unpublished data.
Figure 5. V̇E/WR relationship during exercise in pediatric CF patients compared to healthy peers. Redrawn after Bongers et al. [Citation44].
![Figure 5. V̇E/WR relationship during exercise in pediatric CF patients compared to healthy peers. Redrawn after Bongers et al. [Citation44].](/cms/asset/8947346b-3d5d-46c3-b3ae-d55e6bcd8e24/ierx_a_1752195_f0005_oc.jpg)
Figure 6. Typical responses of CPET data.
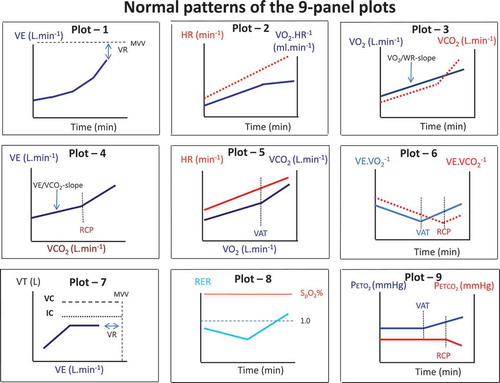
Figure 7. The seven-step interpretative strategy for a pediatric CPET.