
Figures & data
Figure 1. Speckle tracking of a patient with idiopathic pulmonary fibrosis at rest
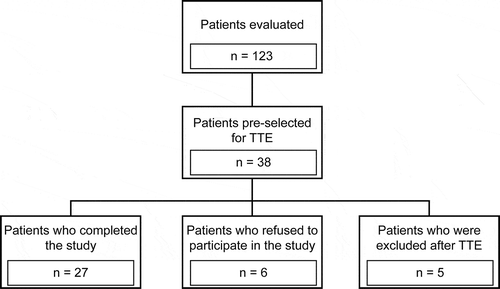
Figure 2. Patient selection flowchart. TTE, transthoracic echocardiography
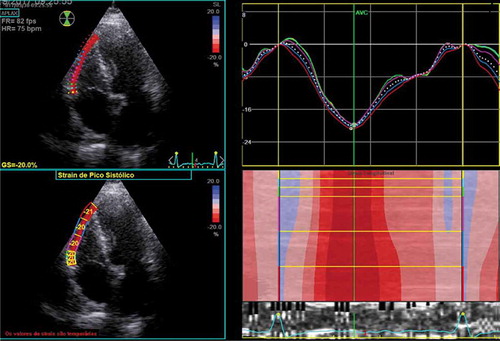
Table 1. Demographic data and functional characteristics of the patient sample
Table 2. Baseline echocardiographic parameters and their relationships with RV function using the speckle-tracking strain technique
Figure 3. Estimated mPAP during exercise between patients with and without RV dysfunction in the entire cohort. mPAP, mean pulmonary artery pressure; RV, right ventricular
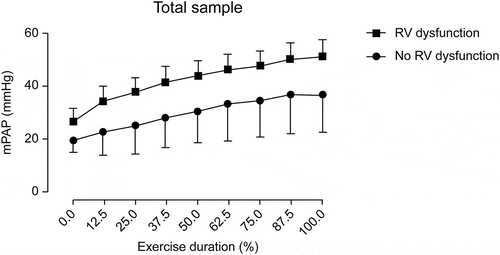
Figure 4. Estimated mPAP during exercise between patients with and without RV dysfunction in normal sPAP subgroup. The normal sPAP subgroup consisted of patients with normal sPAP at rest. mPAP, mean pulmonary artery pressure; RV, right ventricular; sPAP, systolic pulmonary artery pressure; PH, pulmonary hypertension
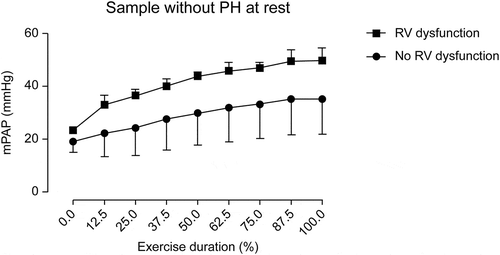
Table 3. CPT data related to RV function
Table 4. CPT data related to RV function according to subgroups with SpO2 ≥ 95% and SpO2 < 95%
Table 5. Pearson correlation coefficients between CPT data and mPAP at rest or exercise
Data availability
The data that support the findings of this study are available on request from the corresponding author, SBC. The data are not publicly available due to their containing information that could compromise the privacy of participants.