
Figures & data
Figure 1. The relationship between statistical and computer science disciplines
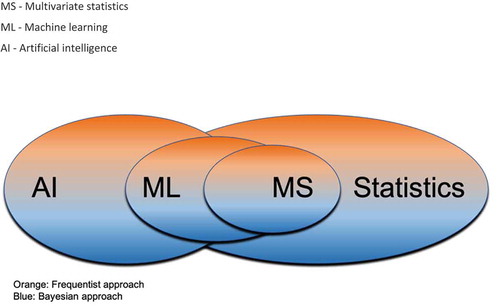
Figure 2. Annual publication production
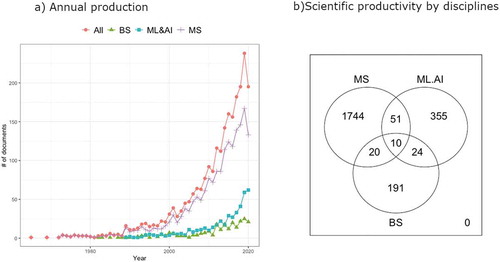
Table 1. Summary information on retrieved asthma studies, 1965–2020
Table 2. The 10 most productive authors in the application of Multivariate statistics (MS), Machine learning and artificial intelligence (ML&AI) and Bayesian statistics (BS) to asthma research
Table 3. The 10 most productive countries in the application of Multivariate statistics (MS), Machine learning and artificial intelligence (ML&AI) and Bayesian statistics (BS) to asthma research SCP: single country publications; MCP: multiple country publications
Figure 3. Themes in asthma research fields
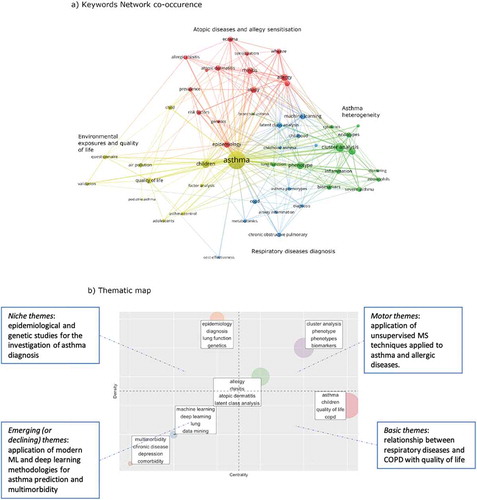
Figure 4. Word-clouds for the eight topics in asthma research
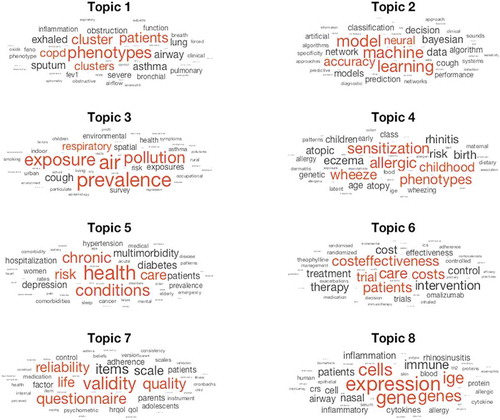
Figure 5. Distribution of the big data analytics approaches in the eight topics
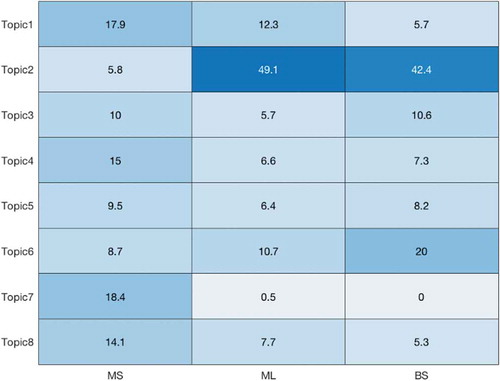
Table 4. Distribution of the major methodologies across the selected articles