
Figures & data
Figure 1. Prevalence (a), Incidence (b), Mortality (c) and Burden of COPD (d) in countries according to income level during 2000–2020 [Citation19,Citation21]
![Figure 1. Prevalence (a), Incidence (b), Mortality (c) and Burden of COPD (d) in countries according to income level during 2000–2020 [Citation19,Citation21]](/cms/asset/32d0de8f-fa87-48c8-8178-11350b20236c/ierx_a_1985762_f0001_oc.jpg)
Figure 2. Drivers of good COPD care (Adapted by IPCRG from WHO Health Systems 6 Building Blocks Framework for Universal Coverage) S. Williams 2021
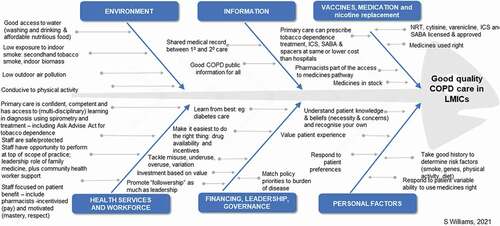
Figure 3. World map showing countries with (Yes) or without (No) operational policy/ strategy/ action plan to decrease tobacco use according to income (2019) [Citation42]
![Figure 3. World map showing countries with (Yes) or without (No) operational policy/ strategy/ action plan to decrease tobacco use according to income (2019) [Citation42]](/cms/asset/876226c3-e970-4e04-9fc6-5fcb552e47f2/ierx_a_1985762_f0003_oc.jpg)
Figure 4. World map showing countries with (Yes) or without (No) availability of peak flow measurement spirometry at the primary health care level according to income (2019) [Citation80]
![Figure 4. World map showing countries with (Yes) or without (No) availability of peak flow measurement spirometry at the primary health care level according to income (2019) [Citation80]](/cms/asset/8731f53c-30f9-407c-a210-0370b580042e/ierx_a_1985762_f0004_oc.jpg)
Table 1. WHO model list of essential medicines for COPD [Citation101]
Table 2. Percentage of countries meeting the WHO medicine requirements for COPD (adapted from Ewen et al. (2017)) [Citation102]