
Figures & data
Table 1. Descriptive statistics of the total quantity (in millions) of medicines in dosage units from January 2019 to February 2020 (14 months before the pandemic) and March to October 2020 (7 months after pandemic’s onset); Standard Deviation (SD)
Figure 1. ARIMA (1,0,0) montelukast, tiotropium bromide, salbutamol, aminophylline hydrate, ipratropium bromide, theophylline, beclometasone dipropionate. The x-axis presents sequential months (one representing January 2019 and 22, representing October 2020). The y-axis represents total quantities of doses reimbursed
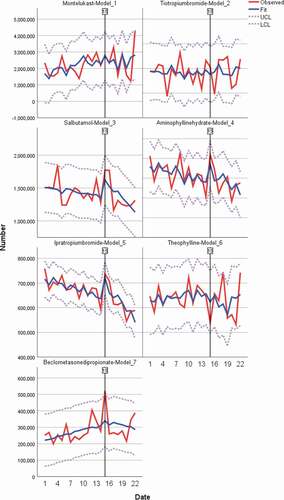
Table 2. ARIMA (1,0,0) models
Supplemental material
Supplemental Material
Download Zip (1.1 MB)Data availability
Data are available from https://opendata.nhsbsa.net/dataset/english-prescribing-data-epd