
Figures & data
Figure 1. PRISMA flow diagram of included and excluded studies.
Figure 2. Box and whisker chart demonstrating the percentage prevalence expressed as a median (horizontal line within the box) and interquartile range (whiskers). Dots represent outliers within an individual gastrointestinal symptom.
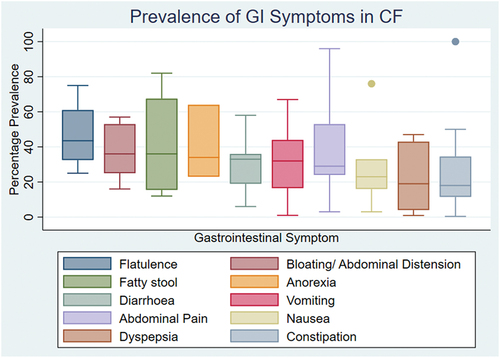
Figure 3. Box and whisker chart showing the percentage prevalence of the complications associated specifically with CF: DIOS and meconium ileus. The percentage prevalence is expressed as a median (horizontal line within the box) and interquartile range (whiskers). Dots represent outliers.
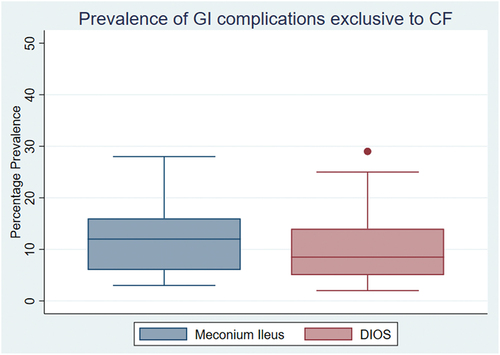
Figure 4. Box and whisker chart demonstrating the percentage prevalence expressed as a median (horizontal line within the box) and interquartile range (whiskers). Whiskers are missing where there are ≤ 3 studies contributing to the calculated prevalence due to the lower and upper quartile value being the same as minimum and maximum value.
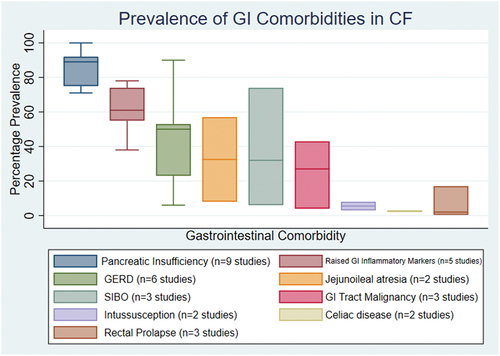
Table 1. Comparison of reported data on the incidence and prevalence of GI complications and comorbidities in CF. The first column reports the median percentage prevalence calculated from the studies included in the review. The second column shows the incidence reported in the CF Foundation registry report 2021. The third column shows the incidence reported in the CF Trust registry report 2021. *Likely much higher due to selection bias.