Figures & data
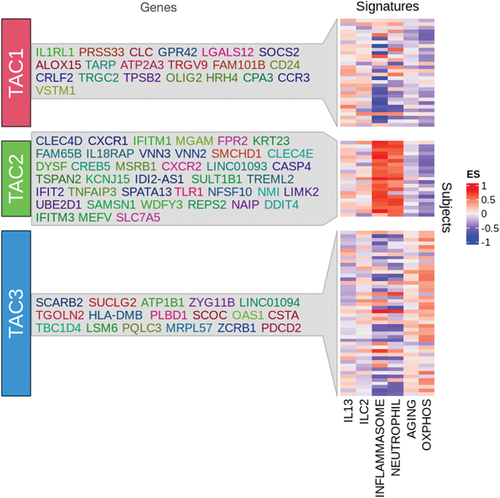
Figure 1. List of gene signatures associated with each of the transcriptome-associated clusters (TACs) and GSVA heatmap of signatures associated with specific pathways. Heatmap showing the GSVA enrichment score of the pathway signatures for IL13-Th2, ILC2, inflammasome, neutrophil, aging, and OXPHOS grouped by the TACs. (Data taken from Kuo et al. T-helper cell type 2 (Th2) and non-Th2 molecular phenotypes of asthma using sputum transcriptomics in U-BIOPRED. Eur Respir J. 2017;49(2): 1602135.).