
Figures & data
Figure 1. The generations of the human bronchial tree. The branching structure of the airways commences at the level of the trachea, extending into the lungs as bronchi, bronchioles, and alveoli. The small airways, characterized by a diameter of less than 2 mm, typically emerge from approximately the seventh or eighth generation of bronchi. These small airways include the terminal bronchioles, which do not participate in gas exchange, as well as the respiratory bronchioles, which occasionally contain alveoli, and the gas-exchange area, encompassing the alveolar ducts and alveolar sacs. Created with BioRender.com.
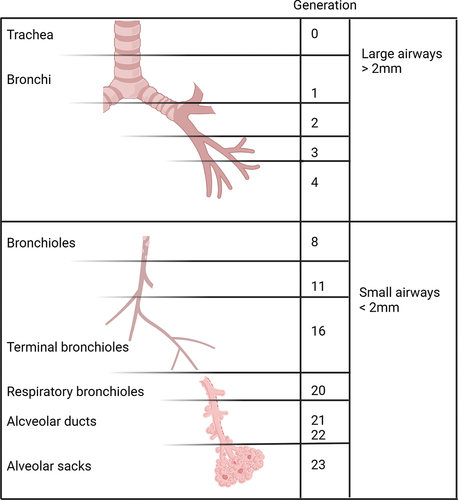
Table 1. Currently available techniques for the assessment of small airways disease.
Figure 2. The single-breath nitrogen test. During the test, the subject maximally exhales to RV and then inhales a VC of 100% oxygen. From TLC, the subject slowly exhales back to RV while recording the nitrogen concentration on an X-Y axis. Four phases are typically identified: phase I represents pure dead space, phase II represents a combination of dead space and alveolar gas, phase III represents alveolar gas, and phase IV is known as the closing volume (CV). This volume identifies the point at which the peripheral airways stop contributing to lung deflation and is usually assumed to be approximately 0.8. An increased CV indicates premature closure of the small airways due to peripheral lung injury or dysfunction. In particular, the slope of phase III appears to be a sensitive indicator of early changes in the airways or lung parenchyma. An increased slope of phase III is associated with poor homogeneity of ventilation and compromised gas exchange. RV: residual volume. VC: vital capacity. TLC: total lung capacity. Created with BioRender.com.
Table 2. The currently available therapeutic options with the potential to target the small airways and their mechanisms of action in the lungs.