Figures & data
Table 1. Key features of the applied model
Figure 1. SD models used in this work and linkages with other models, by method
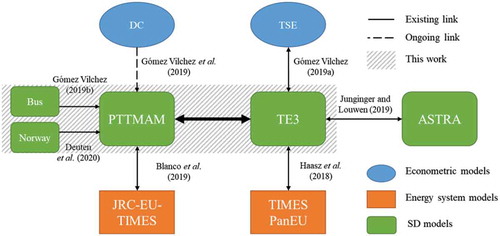
Figure 2. Soft-linking process chart
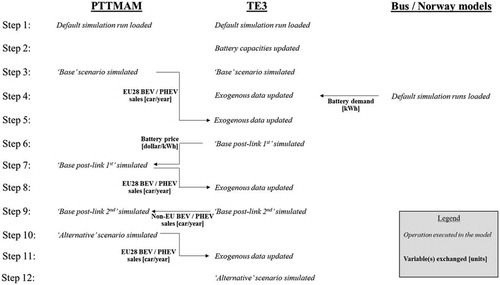
Table 2. Main assumptions
Table 3. PHEV and BEV battery capacities
Table 4. CO2 emission targets [gCO2/km], by level of policy ambition
Figure 3. Battery cost before model linkage, data versus simulation
Figure 4. Electric vehicle battery market: estimated annual supply and demand, by type
Figure 5. Annual electric car sales before model linkage, data versus simulation
Figure 6. Battery price after model linkage, data and trajectory versus simulation
Figure 7. Annual electric car sales after model linkage, data versus simulation
Figure 8. Annual electric car sales in the EU, by simulation run
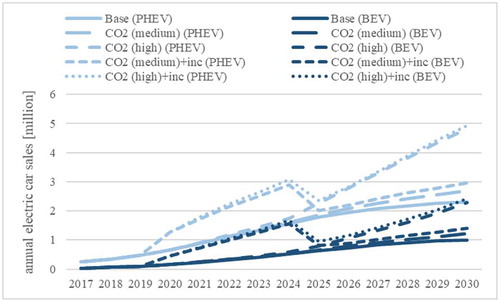
Figure 9. Electric car stock in non-European countries, by simulation run
Figure 10. Monte Carlo simulation of non-European electric car stock: with model coupling (left) and without (right) [M =million]
![Figure 10. Monte Carlo simulation of non-European electric car stock: with model coupling (left) and without (right) [M =million]](/cms/asset/883b08b3-9df9-4399-9391-886fbf727969/tjsm_a_1781556_f0010_oc.jpg)
Figure 11. Car-mix in key markets: “Alternative” [left] and sensitivity-based run [right]
![Figure 11. Car-mix in key markets: “Alternative” [left] and sensitivity-based run [right]](/cms/asset/08f6cd3c-e67f-4e22-9a3b-e786fddfffed/tjsm_a_1781556_f0011_oc.jpg)
Figure 12. Electric car stock disaggregated by type and country, by run
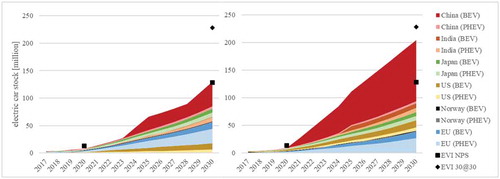
Figure A1. Simulated output of the “Bus” and “Norway” models
Figure A2. Annual electric car sales in France and Germany [left] and Japan [right], data versus simulation before model linkage
![Figure A2. Annual electric car sales in France and Germany [left] and Japan [right], data versus simulation before model linkage](/cms/asset/ec1dcb2f-3bbe-4b88-a759-f460d540912a/tjsm_a_1781556_f0014_b.gif)
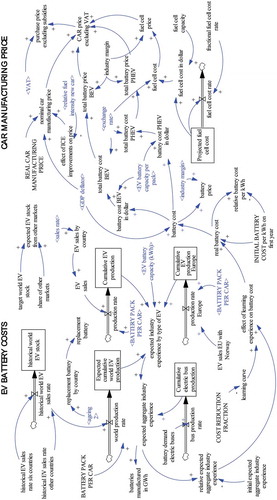
Figure A3. Overview of the “production costs” module in the te3 model