Figures & data
Figure 1. Sub-system diagram of the Copenhagen Urban Development Model
Figure 2. The average change in population density (left) and road surface (right) for all zones in the Copenhagen metropolitan region
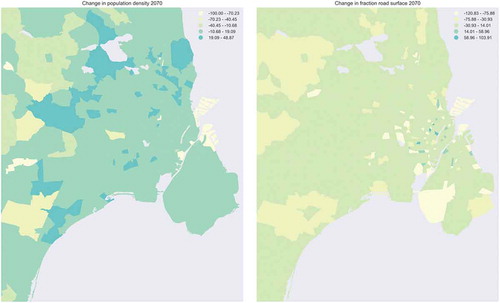
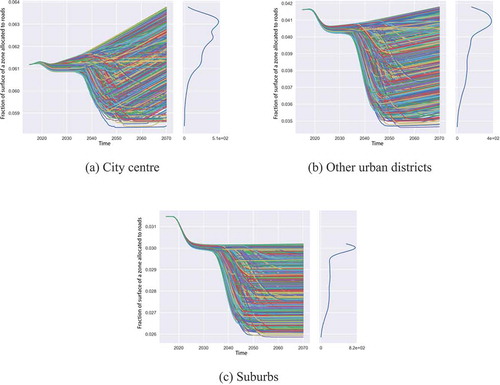
Figure 3. Base ensemble change in road surface for city centre (a), other urban districts (b), and suburbs (c). The subplots on the right of (a), (b), and (c) show the density of runs in each value in the end state