Figures & data
Figure 1. Three stage framework.
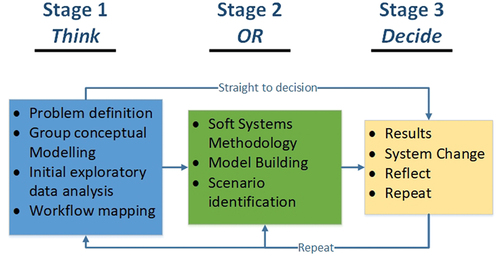
Figure 2. Group model of factors affecting CT service.
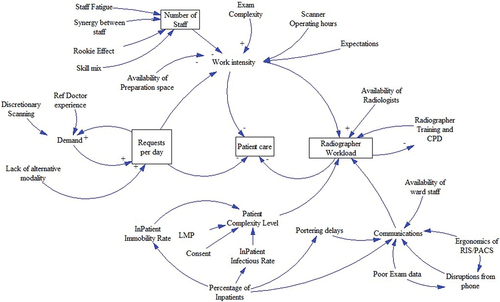
Table 1. Process validation using mean time in system (minutes).
Figure 3. Factors affecting CT service.
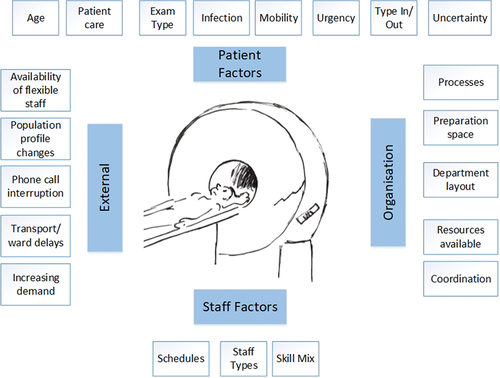
Table 2. Comparison of process metrics for mixed IP/OP and OP only services.
Figure 4. Consumed staff time (minutes) for each exam type.
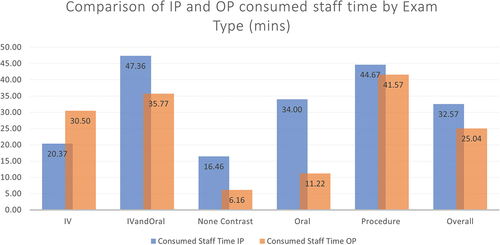
Figure 5. Variation in daily radiographer utilisation.
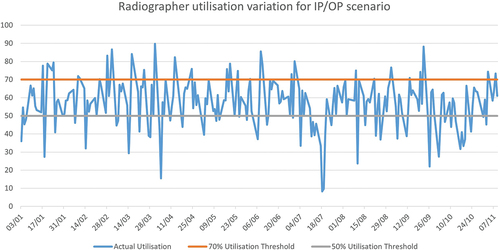
Figure 6. Comparison of resource utilisation for mixed versus outpatient only scanner.
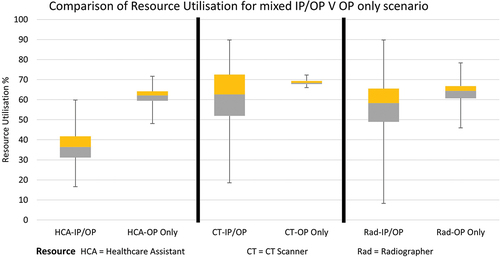
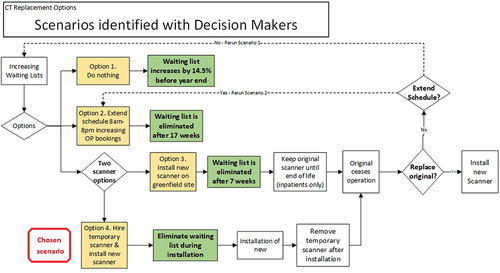
Figure 7. Decision tree for presentation of results from DES model.